
From an essay by Mira Ptacin in Goodbye to All That: Writers on Loving and Leaving New York.
Ptacin writes about relocating to Maine from New York City, and how her first week was spent at the home of a grieving family friend:
Here are some of the things I learned at Rosemary’s that first week after leaving New York: I learned that when a widow is crying and smoking a cigarette, you let her cry, and if you speak, it’s to ask if you can get her another Diet Coke. I learned that no one cares that much what you do for a living, but they will be grateful if you stay up with a six-year-old and watch Dennis the Menace because his grandfather is dead and he cannot sleep. Rather than get into a political debate about the war, you thank an Iraqi veteran for his service. You do not check your BlackBerry in the middle of a toast, and when someone hands you a crying baby, you hold it. I learned that ice cream cakes make grandpas feel really special, and when a neighbor invites you to swing by the food pantry during her volunteer shift so that she can take a look at that nasty poison oak on your shin, you go, and you wait patiently until she can get free to see you. I learned that you don’t judge someone’s worth based on what they can do for you and that you aren’t expected to ask, “How can I help?” Instead, you just jump right in.
On Saturday afternoon Oliver insisted that we leave lumpen form at home and go out on the town for some fun, in part to celebrate the birthday of our next door neighbour.
At the last minute I threw my sketchbook in my back pocket; it’s a habit I’d fallen out of in recent months, and something I miss.
We landed at Receiver Coffee, having muffins, coffee, and a London Fog. I used the opportunity to make a quick sketch of Oliver; I pulled my long-dormant watercolour set out my bag and added some hints of colour.
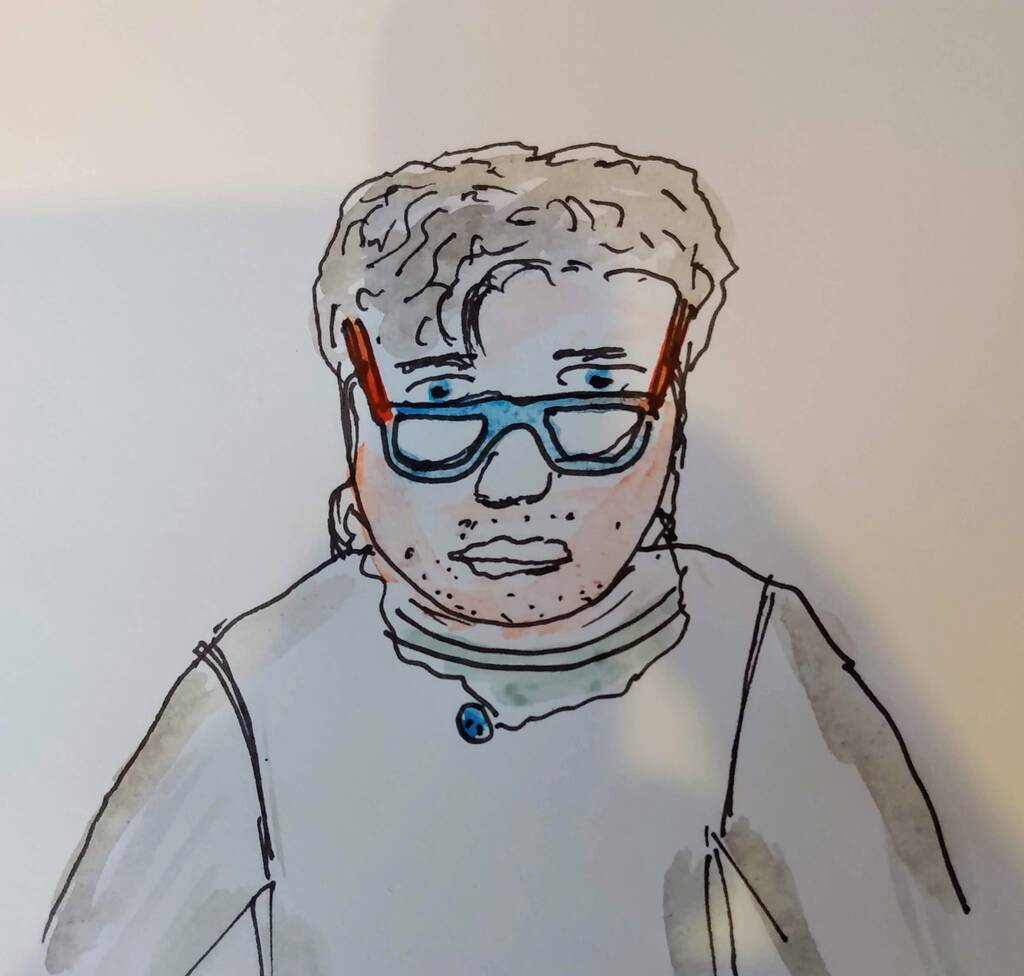
Its a rusty sketch, which reflects my time away from the pen. Oliver didn’t look nearly as bereft as I’ve rendered him. But I do think that I managed to capture some of his essential Oliver.
We continued on our way, stopping at The Bookmark to buy aforementioned neighbour a birthday present, and then, when we dropped it off next door, found ourselves invited in for a pleasant evening of tea, birthday cake, and conversation.
All hail Oliver, my social animator-in-chief.
Facebook knows you’re pregnant before you’re pregnant.
Spotify is in on this game.
Yesterday I hit “shuffle” on my Spotify “Discover Weekly” playlist, and the first three songs it played were:
- The Book Of Love, Peter Gabriel
- You Can’t Rush Your Healing, Trevor Hall
- Only You, Jimi Charles Moody
Now all credit to Spotify: I had been playing covers of I Think It’s Going to Rain Today on rotation for a few days, sending up a fairly obvious signal flare.
But really, Spotify robots, you play me a song with this as the chorus:
So, you can’t rush your healing
Darkness has its teachings
Love is never leaving
You can’t rush your healing
Your healing
Fortunately, I’ve arrived at a place where descending into a torrent of tears, or some variation thereof, seems like a pretty healthy thing to be doing. So a hat-tip to the robots.
Also, The Book of Love is an amazing song, especially the Peter Gabriel cover.
And from there it’s a short hop, skip and jump to The Power of the Heart, which Lou Reed wrote for Laurie Anderson as a marriage proposal and Peter Gabriel also covered.
You looked at me, I looked at you
Your sleeping heart was shining through
Wispy cobwebs that we’re breathing through
The power of the heart
That’s not such a bad place to dwell.
For the first month we had our Kia Soul EV electric vehicle, we charged it from a regular 120 volt outlet at the end of our driveway, an outlet originally installed to power the heating cables to keep ice dams from forming on our roof. We used the portable charger that came with the car. While this was convenient, inasmuch as it didn’t require us to install anything, charging the car this way is very slow: at least overnight to go from 50% to 100%.
When we needed faster charging we used “level 2” chargers at places like Access PEI and Efficiency PEI; these 240 volt chargers charge much more quickly, and can go from 50% to 100% in just a few hours.
On January 18, 2020 a new option became available, a high speed “level 3” charger off the Canadian Tire parking lot in Charlottetown. This charger can take our Kia Soul from empty to 80% in less than half an hour.

This faster charging comes at a hefty price: because only Maritime Electric can sell electricity, the use of this charger is billed by time, not energy, at a rate of $20 per hour.
The first time we used it we paid $14.84 for 8.06 kWH of electricity (a whopping $1.84 per kWh, or about 13x what we pay for electricity at home); four days later we paid $7.02 for 10.5 kWh (still an almost 5x premium over retail electricity). What determines the rate of charge, and thus the cost per kWh, I do not know.
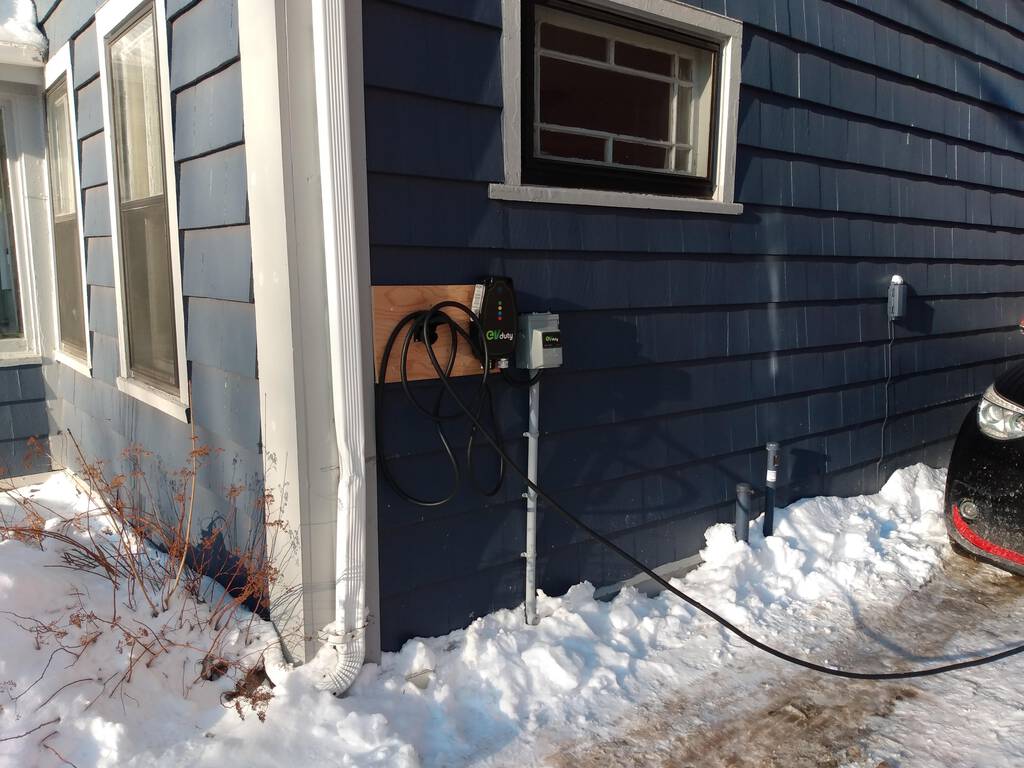
A couple of weeks ago, our electrician came to install the wiring–a 240 volt “dryer” outlet in a weatherproof box–for our own EVDuty-brand charger, which we received as part of the purchase of the Soul from Pure EV in December. And finally, late last week, I got around to mounting the charger itself on the side of the house:
There are several benefits having a level 2 charger at home:
- The faster charging time means that I’ll rarely, if ever, get caught without a way to quickly charge the car.
- I can set the Kia Soul EV up to automatically charge to 80% or 100% every night if I like, as long as it’s plugged in, and I can also set it to warm and defrost the vehicle, from the mains electricity not the battery, so that it’s ready to drive at a time I set.
- The charger is there for others to use; outside of the flaky charger in the parking garage of the Delta Prince Edward, this makes it the first EV charger in downtown Charlottetown. And while I can’t support full-on public charging–I need to be able to get my own car in and out!–I’m happy to offer those that need it a “top up.”
So far I’m happy with the EVDuty charger: it does what it says on the tin, and, after I paid a $100 upgrade fee online, I have real time access to the charger via an app on my Android phone.
I’ll report back once I’ve had more experience with the charger.
Widowers never seem to write about the logistics of death. Which is understandable, given the emotional torrent involved in having your spouse die.
But the result is that those logistics remain a mystery: a dark threshold of potentially endless complexity looming at the end of a fraught hallway.
Herein is my attempt to mitigate some of that.
Provincial Palliative Care Centre
Catherine knew that her cancer was incurable from the get-go, so she had five years to live with that fact. She used her time well, and she didn’t beat around the bush about preparing as much as she could for the end of her life. As part of that she visited the Provincial Palliative Care Centre the year after she was diagnosed, and she decided that’s where she wanted to die when the time came.
On December 29, 2019, Catherine woke up confused, hallucinating and shaking; she called Palliative Home Care and the on-call nurse came quickly and, after consulting with a doctor, suspected that Catherine was dealing with the effects of morphine toxicity from her pain medication. She called 911 and paramedics arrived after only a few minutes, and agreed to transport Catherine to the ER at Queen Elizabeth Hospital. Catherine remained in the ER overnight.
It became clear to me, and ultimately to her, that she couldn’t reasonably expect to return home. While she was still in the emergency room, she had a visit with Dr. Lecours, one of the palliative care physicians, and Dr. Lecours started the wheels in motion to allow Catherine to move to the Palliative Care Centre; there weren’t any beds available immediately, so Catherine was admitted to ward one at the hospital for a few nights.
On New Year’s Eve, Oliver and I toured the Palliative Care Centre so that we’d know what to expect when Catherine moved there; we should have done this earlier, as it provided enormous comfort to see what a wonderful, welcoming place it is, and to meet the staff.
On New Year’s Day 2020 a bed became available in the Palliative Care Centre and Catherine was transported there by ambulance.
Over the next 24 hours, the effects of morphine toxicity started to lessen, and Catherine started to emerge from her fog. From then until January 13, while she was tired and increasingly frail, and sleeping through much of the day, she had times of the day when she was alert and communicative, and we got to spend a lot of time with her.
The Palliative Care Centre truly is a wonderful place: it is calm, as un-hospital-like as its functions allow, and while the primary focus is on the person in palliative care, the practical and emotional needs of their family are also afforded much attention.
It was rare that either Catherine’s mother Marina or I were not at her side while she was in Palliative Care, and for the last week of her life I stayed overnight with Catherine in her room, first on a cot and then, for the last three nights, on a recliner beside her bed. I was provided with meals. I had regular opportunities to talk with Dr. Baker, Catherine’s palliative care physician, and got to know almost all of the nurses and volunteers by name.
The services of the Palliative Care Centre are 100% covered by provincial medicare.
Death
On Tuesday, January 14 I came home for the afternoon to have a nap and get some fresh clothes. Midway through my nap I got a call from a nurse at the Palliative Care Centre: something had changed with Catherine, and I should come right away, she said. I hopped in the car and was there in about 8 minutes. When I arrived it was obvious that Catherine’s breathing had changed, and that she was in some distress. Dr. Baker asked if it was okay to administer a sedative to relax her, and I readily agreed.
I sat by Catherine’s side for the next 12 hours, fully believing that she was about to die with every breath.
She did not die.
But she didn’t wake up either, and we never spoke again.
She lived, breathing calmly and with no distress, through Wednesday and Thursday. I didn’t leave Palliative Care, and didn’t leave her room through the evening hours, except for quick runs to the bathroom and shower while the nurses were with her.
On Thursday Oliver spent the day at Palliative Care: they generously set aside the “family room” for him, and set up a DVD player, and Oliver and Mike and Karen and my mother spent the day together, visiting Catherine every few hours, and spending time with Catherine’s mother.
Before supper time everyone else headed home for supper and much-deserved rest. Oliver gave Catherine a big hug before he left (after making sure that I turned off the “bed alarm”–he didn’t want to go to bed alarm prison).
After supper, I started to notice a subtle change in Catherine’s breathing: it was shallower, and slower.
I settled into the recliner at her side for the evening, and continued to read Life’s That Way by Jim Beaver, a gift from my friend Derek, that I’d started earlier in the week.
At 9:20 p.m., after stirring a little, and almost opening her eyes, Catherine simply stopped breathing.
I called a nurse, and she came in to confirm that Catherine had died, and stayed with me for a few moments. I asked if I could spend some time with Catherine alone, and she readily agreed.
I texted my brother Mike, let Catherine’s mother know, and then sat at Catherine’s side, holding her hand.
None of this was anything like I expected it to be. I cannot do the emotional or spiritual aspects of living through it justice in words; it will remain the singular experience of my life, being at her side when she was alive, and then, a moment later, wasn’t.
Cremation
Catherine was cremated, at her request. She had some discomfort with the idea related to the environmental consequences of cremation itself, but she didn’t want to be buried, and so cremation was the best of the worst options available.
We didn’t start to make any practical arrangements for what would happen when she died until last fall, when I sent a tentative email of inquiry to Hillsboro Funeral Co-op in Stratford, selected because of its cooperative nature and its proximity; once Catherine moved to the Palliative Care Centre, I made an appointment to go to speak with Shawn MacLean, the General Manager, and we came up with a plan for the minimalist arrangements that Catherine wanted. Shawn was extremely accommodating and willing to provide exactly the services we needed and nothing more.
I left that meeting without a formal “pre-arrangement,” but having purchased a $50 co-op membership, which entitled us to 5% off the cost of cremation, and with a sketch of what would happen next: when Catherine died, the Palliative Care Centre would call Shawn, he would pick up Catherine’s body, transport it to Kensington for cremation, and return her remains to us. Shawn would also, at my option, arrange for a death notice in The Guardian.
And that’s pretty well exactly how things happened: Catherine died at 9:20 p.m. on Thursday, January 16, 2020; Oliver my brother Mike, sister-in-law Karen, and my mother arrived shortly thereafter and we spent about an hour with her. Palliative Care called Shawn, and he came that night after we left. Catherine was cremated on Saturday, January 18, 2020, and Shawn, driving through a blizzard, picked up her remains the next day and, on Monday, transferred them into the lovely urn that our friend BJ and Catherine’s mother constructed.
Catherine’s remains are sitting beside me as I write this; a plan is emerging to spread them this fall, extending from a question Oliver asked Catherine about what her favourite month was (“October,” was her answer).
The cost of the cremation was $3377.25.
Death Notice
A couple of years ago I started to read the deaths in The Guardian every day, ascending therein to a new level of neo-Islanderhood. This meant that I was well-familiar with the form. I started to write Catherine’s death notice while she was still alive, though I didn’t tell anyone else that I was doing this, in part because there remains a strong chord of “talking about death brings it on” in our culture. I’m glad that I did this: it meant that I didn’t have to write it in the overwhelming hours after she died; and it gave me a chance to get the details–spelling, birth order of nieces and nephews, etc.–correct.
While I could have submitted the notice to The Guardian myself, Hillsboro Funeral Co-op handles this at no additional cost, so I had them do it. They made a couple of stylistic suggestions, but it ran essentially as I wrote it. It went online on Friday, January 17 and ran in the newspaper on Saturday, January 18.
I’m something of a student of death notice photos, and this is something that Catherine and I never talked about, so I was on my own. While I had a few photos picked out, and one that seemed to be the best, BJ helpfully provided the one that I ended up using:
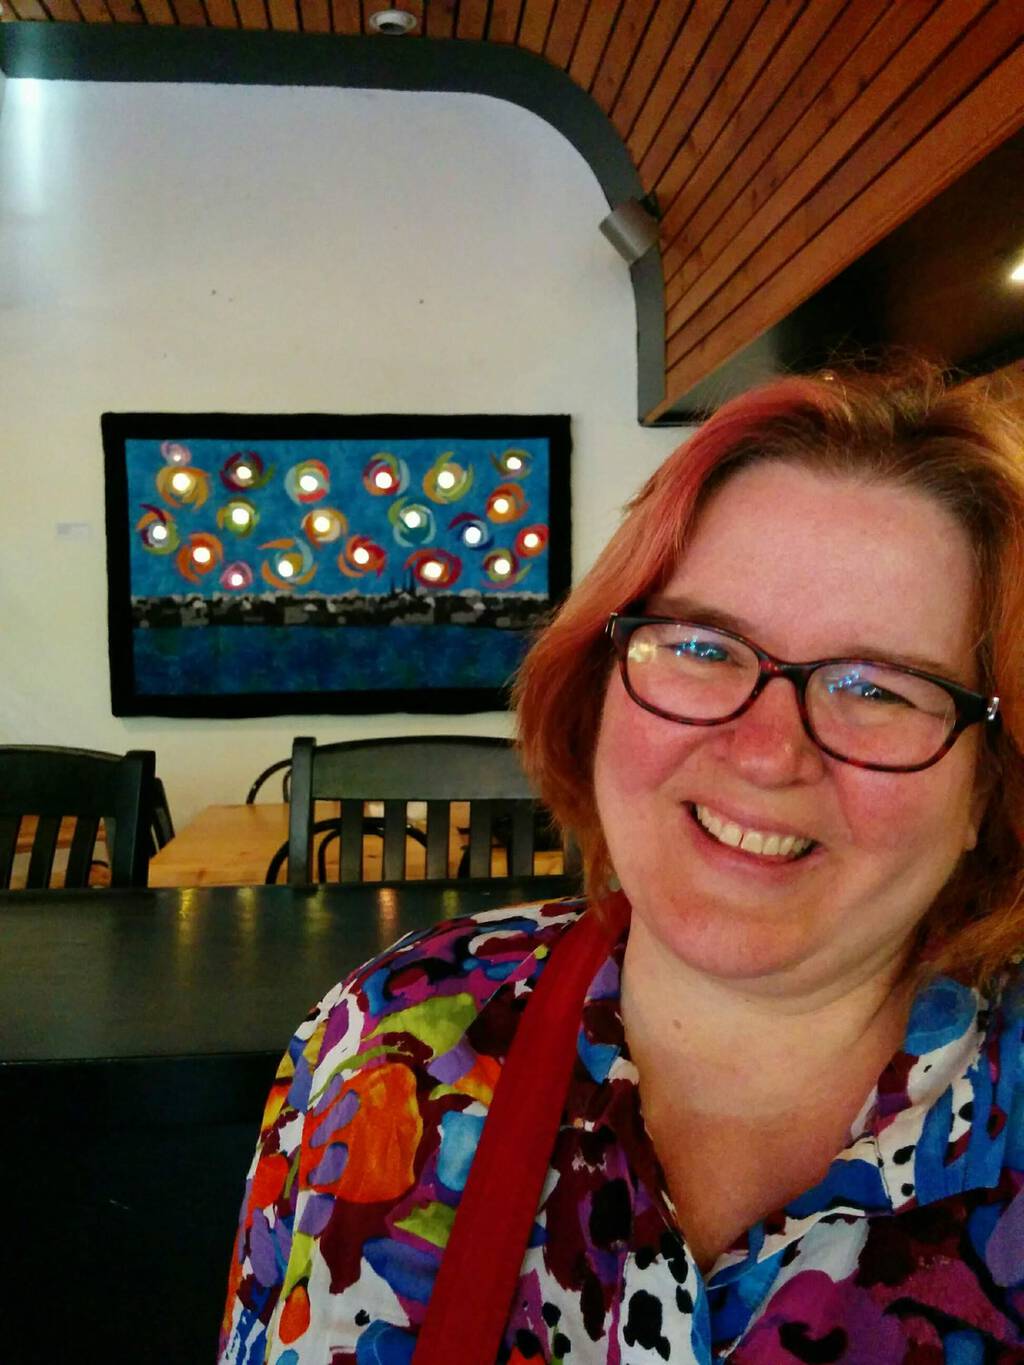
It was the perfect photo.
The cost of the death notice in The Guardian was $238.20.
Celebration of Life
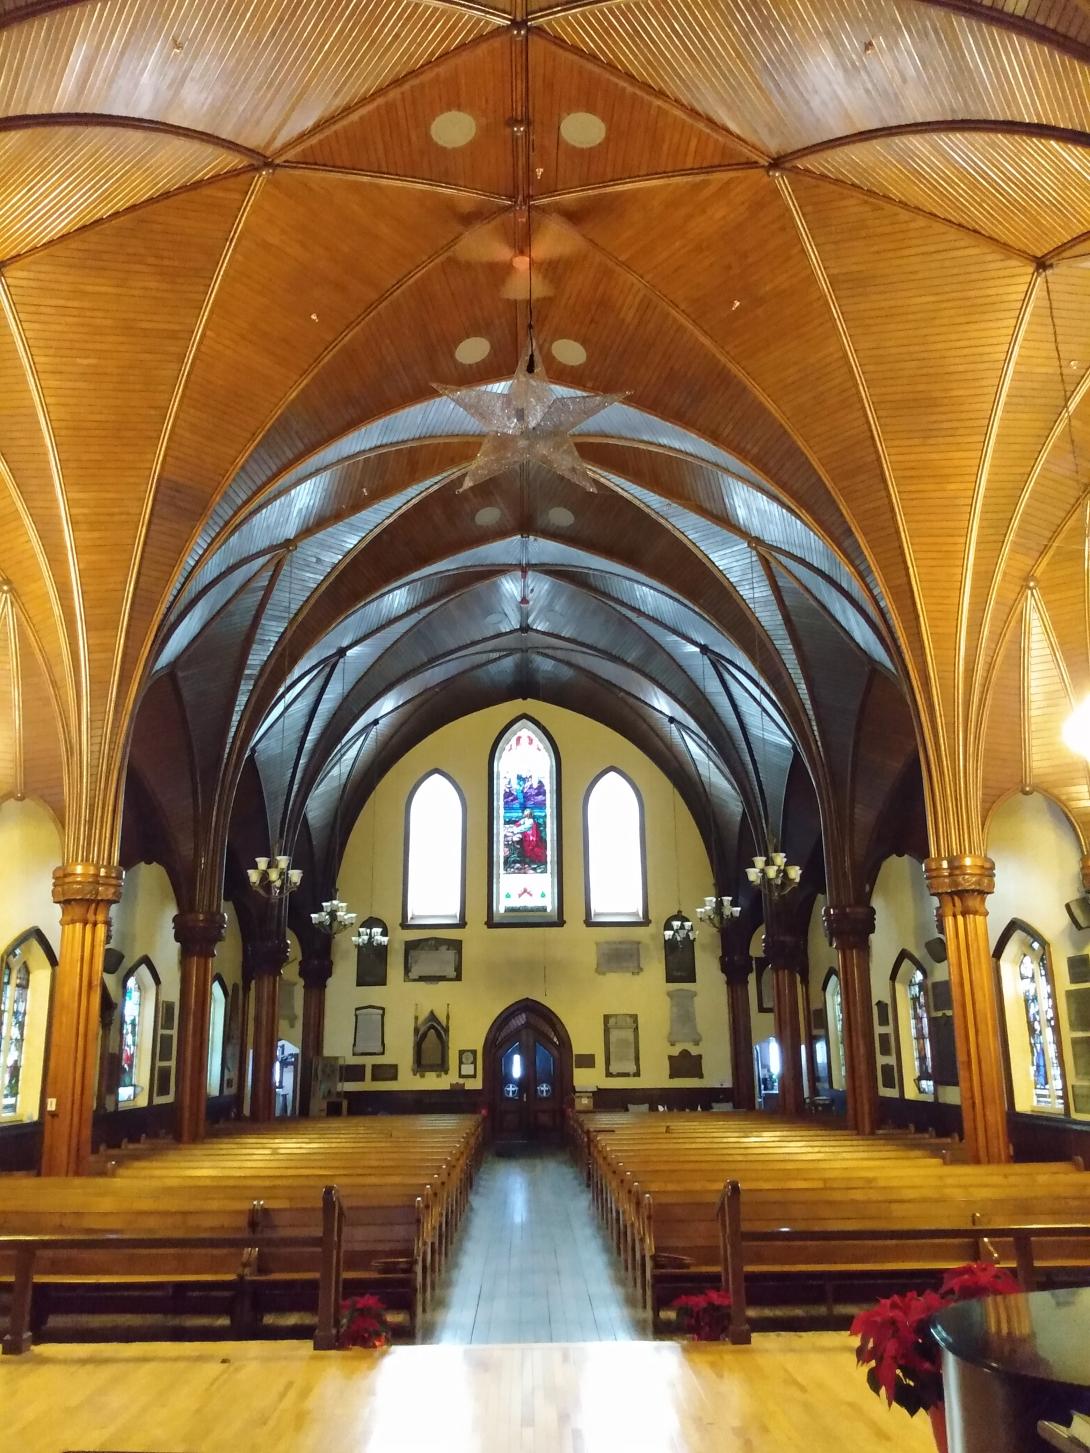
While Catherine had made arrangements to have a memorial event to mark her death held at St. Paul’s Anglican Church, directly across the street from our house, we’d never really talked about the particulars of it in any great detail. We got a bit of a chance to do this when she was in the Palliative Care Centre, and everything else I had to make up as we went along.
On January 4, 2020 I had a meeting in Archdeacon John Clarke’s office in the Parish Hall to speak with him about what our options were, and to sketch out Catherine’s wishes for a “non-religious” event. John turned out to be the perfect person to talk to, not only for his flexibility in helping to fulfill Catherine’s wishes, but for the conversation and counsel he offered; on that day I needed to talk to a calm, reassuring presence, and John gave me the gift of that.
Catherine’s original plan for the event, given its secular nature, was for it to be held in the Parish Hall. John held open the option of using the church proper as an alternative, something that I don’t think ever occurred to Catherine, not necessarily for reasons of faith as much for reasons of “fuss.”
After talking with John, and with Catherine’s mother, and getting a sense of the number of people who might attend, I decided the church would, in fact, be the right place, and that’s how we proceeded.
Catherine died on Thursday; her Uncle and Aunt were set to arrive from Ontario on Saturday, my brother Johnny was set to arrive from California late on Sunday, and so Monday became the day for the celebration of Catherine’s life. The time was set for 11:00 a.m. because, apparently, while other churches use 10:00 a.m., events at St. Paul’s are, for reasons only of conventional wisdom in the funeral community, held at 11:00 a.m.
Earlier in January, after meeting with John, I’d gotten in touch with Robert Pendergast about catering the celebration, as Catherine wanted there to be food; it’s not an easy task, the “I’d like you to cater an event for an undetermined number of people on an undetermined date,” but Robert gamely agreed.
I’d also started to put out feelers about the music that might be part of the celebration: Peter Bevan-Baker generously arranged to make Dougie MacLean’s Caledonia happen, and recruited Michael Pendergast; Tony Reddin reached out to Oliver with an offer to play, and Oliver suggested Big Yellow Taxi by Joni Mitchell as one of Catherine’s favourite songs, and Tony agreed; and Roy Johnstone readily agreed, at the last minute, to finish the celebration with Niel Gow’s Lament for the Death of His Second Wife.
Others emerged to help make the event happen once the date was set: Catherine’s mother, BJ, and our friend Carol arranged a display of Catherine’s artwork at the front of the church; Isaac and Perry Williams stepped forward with an offer to handle everything related to the webcast of the event; brothers Mike and Johnny and sister-in-law Karen set up the tables and chairs in the hall on the morning-of.
St. Paul’s Anglican Church provided the church and the hall at no cost.
Receiving Line
Because we mostly bootstrapped the event, the things that funeral directors think of, like guest books and name tags, we either forgot about or made up on the spur of the moment.
I didn’t plan on having a “receiving line” at the entrance to the church, but it spontaneously erupted once I stood near the entrance and people started hugging me. The rest of the family soon formed a line behind me.
I’d always thought that being the surviving spouse in a receiving line would be about the most draining and dreadful thing one could ever experience, but it turned out to be completely the opposite of that: I took tremendous comfort from every interaction, and, against type, I ended up hugging about 200 people.
It all felt very much like borrowing a tiny slice of strength from each person. It was entirely because of the receiving line that I was able to make it through the celebration of life intact, and to stand up in front of everyone and speak for 15 minutes without completely breaking down.
Eulogy
I debated whether I would speak at the event for several weeks beforehand.
I knew there must be a reason that the task of eulogizing often falls to a brother or sister, or to a friend, or an aunt or uncle. I researched whether Jackie O spoke at JFK’s funeral (she did not; there was no eulogy at all, it turns out).
I process life primarily through writing about it, and I knew that I’d benefit from being able to write about Catherine. But I was worried that I would start to cry, in front of a bunch of people, and not be able to go on.
The Sunday night before the event, with Oliver in the care of my family, I came across to my office and started to write, just to see what would come out. The eulogy that resulted essentially flowed out of me as I delivered it the next day.
I didn’t break down. Although I did have tears in my eyes.
And having just hugged most of the people in the room, I realized that even if I had broken down, even if I cried for 10 minutes, it would be okay.
Afterparty
Robert Pendergast and his crew set up in the Parish Hall kitchen at 10:15 a.m., and when everyone walked over from the church after 12 noon, they were ready to offer veggie chili served over handmade bread, with fixings to sprinkle on top, the end effect of which was to make every meal a kind of quilt. Receiver Coffee generously dropped off coffee and sweets; Robert boiled up some tea. Catherine would have been very pleased: it was just the kind of thing she’d like.
Almost everyone who’d been in the church walked over to the hall, and it was so, so lovely to be immersed in that crowd (if you’re going to be immersed in a crowd, as an introvert, being immersed in a crowd of people who loved your partner is a good crowd to be immersed in).
Many stories of Catherine were told. Many “oh, I didn’t know you knew Catherine too” coincidences were discovered (she had her oars dipped in many different communities).
Over the course of the afternoon people took their leave and, at the very end, I stood by the remaining food, snacking between Pendergasts Michael and Robert.
Catherine
As Oliver and I got ready to head home, I realized that someone had brought over Catherine’s remains to the Parish Hall and placed them on the alter of the chapel, at my suggestion.
We almost forgot her there! But, at the last minute, we remembered (“where’s Catherine!?”). We gave her a good home for the night, and then headed home ourselves for a nap.
In the end, Catherine died where she wanted, how she wanted, and her death was marked as she wanted, by people who loved her dearly.
The thing I’d forgotten, while I’d been quietly fearing the unknown of all this for the years and months leading up to it, was that we would not be alone: the community that Catherine cultivated around her wrapped itself around us. And continues to do so. What a gift from her that is.
Catherine didn’t believe in God.
Which begs the question, why are we celebrating her life in a space that presupposes God?
The simple answer to that question is this: a few weeks after being diagnosed with incurable cancer in the fall of 2014, Catherine came across the street to ask if the Parish Hall could be used for her memorial service.
She did this not out of piety, but rather proximity: she wanted to make sure that Oliver could attend the event and, if it proved too stressful, that he could have an easy exit across the street to our house.
At that point Catherine didn’t know whether she’d live a week or a month or a year. She wanted to be prepared. And her first thoughts were to Oliver.
So that’s one reason.
Then, in the fall of 2017, Oliver and I came over the church one night for a concert by pianist Sarah Hagen; it was a cold night, so when the concert was over we took a shortcut through the churchyard, and I happened to notice a light on in the Parish Hall basement.
“That’s weird,” I thought to myself, “I didn’t know there was a basement under the hall.”
(I am not very quick on the uptake: I had lived across the street for 17 years at that point).
At the time I was looking for a new space for my office, and so in the morning I emailed the Parish to inquire whether there might be any space available.
As it happens, there was. Indeed that summer a committee had been struck to investigate making better use of the spaces in the hall. So they were primed. And I moved in.
And gradually the life of this progressive parish, theretofore a mystery to us, became a part of our family’s life.
A year later, when Catherine could no longer manage the long climb to her beloved studio on Richmond Street, I asked again: would there be a possibility that the space across the hall could be rented by Catherine?
There was. And she did. And so the Parish Hall, at 101 Prince, became kind of an extension to our house at 100 Prince. Catherine and I became coworkers, of a sort. It was easier for her to get here, and easier for her to get home. And it was close enough so that when Oliver came to the point where he was confident enough to be at home alone for a stretch, he could be there and we here, and we all gained a measure of independence.
As we consumed more of the Parish’s real estate, we also became intertwined with the life of its people: we got to know Clar, and Madonna, and Carolyn, and Otis, and Archdeacon John. The people who come in every week to fold the programs for Sunday services. And the people from the Mi’kmaq Confederacy upstairs.
We held Oliver’s 18th birthday party in the Parish Hall.
Catherine hosted her Stage 4 cancer support group meetings in the chapel every month (a group that survives her; they met on Saturday).
And when we decided, despite the complexity of our lives, to invite 60 friends from around the world to Charlottetown for an unconference last summer, the Parish Hall was the venue.
So that is the second reason we are gathered here, in this sacred space: secularly-minded though we may be, the Parish has given us a warm embrace in recent years, and we truly have come to feel like ex officio members.
Soon after I moved my office into the Hall, I subscribed to the weekly blog posts from John, and I found myself, more often than not, nodding my head in agreement or solidarity with his words, none more so than from the last week of December 2018 when John wrote about the motto the church community had chosen to mark its 250th anniversary, “A Caring Community for All.” He finished the post with a challenge:
But here’s fair warning, “All” means all. Make no mistake about it—everyone, no matter their circumstances or history will find a caring community at St. Paul’s. People ridiculed, ignored, beaten, or lost in this world are welcomed here and will be cared for to the best of our abilities. Or we change “all” to “some” and that just doesn’t seem true to the Gospel.
And that is the final reason that we are here: “A Caring Community for All” could equally be the motto for Catherine’s life as for the Parish: inclusion, justice, solidarity, peace, and a searing belief that “everyone, no matter their circumstances or history, will find a caring community,” were ideas at the very core of Catherine’s soul.
She expressed this publicly in many ways: working toward a world where persons with disabilities are fully embraced as equal citizens, fighting to ensure a woman’s right to choose, making art to draw attention to shoreline erosion and climate change, leading the PEI Crafts Council through challenging times, writing letters to the editor (despite having, essentially, to learn how to write anew every time she set down to do so).
And she expressed this privately in almost everything she did: so many of those who wrote messages of support and condolence over past weeks mentioned something that Catherine had taught them: how to turn flax into linen, how to spin, how to weave, how to sew, how to make that turnip dish with cheese and mushrooms, how to bottle feed a lamb. How to be kind.
Catherine was a teacher in the purest sense: she expected nothing in return for sharing her knowledge; indeed she was as driven to give knowledge away as she was to acquire it.
Beyond that, though, the way Catherine conducted herself knew no boundaries of age or class or circumstance: my brother Mike, who’s been with us here for the last three weeks, mentioned to me that he’s never met anyone with so many people who identified her as their very-best friend. All sorts of people. From all over the place. Met through diverse doorways.
I was one of those people.
Catherine and I, really, had no business being together. No computer algorithm would ever have matched us.
She was a dyslexic weirdo who held bonfires in her back yard every week, and collected bits of metal from around the neighbourhood to turn into art, and had legions of friends. She grew up showing cattle and shearing sheep and going to Junior Farmers dances.
I was a weirdo computer programmer, working at a daily newspaper, passionate about words and letters, introverted to the point of terror. I grew up in the suburbs, hacking computers and volunteering at the YMCA.
But, from the moment we laid eyes on each other when I picked up the key from her for the house next door, in the summer of 1991 on George Street in Peterborough, our lives began to overlap.
I became sweet on her. She became sweet on me.
She made me an orange pop float when I was sick; or maybe it was me who made her an orange pop float when she was sick.
I started to develop a 5-year plan over which I would slowly and carefully woo her; after three months, sitting on the hood of my Toyota Tercel on a moonlit night in the Trent University wildlife sanctuary, she asked me if she could kiss me. The 5-year plan went out the window.
And I became part of her caring community, and she mine: we found a way to merge our weirdo into a strange kind of weirdo conglomerate.
We were never married.
Catherine told me, shortly after we met, that we could be together as long as it worked.
In family lore I describe her as telling me we could be together “as long as we dug each other,” but I don’t actually think she said it that way.
So “as long as it worked” formed the bedrock of our relationship. An active statement, a living statement.
And we did continue to dig each other.
Just two years after meeting we picked up and moved to Prince Edward Island, expecting to stay for 12 months, maybe 18. We bought a house, found more work, Catherine built herself a studio, we developed friendships. And we kind of forgot to leave.
We’d never talked about having children. Until we did: on the car ride home from Christmas in Ontario in 1999 we kind of spontaneously agreed that we wanted to have a child. Three days later, Catherine was pregnant. (Classic Catherine: once you make a decision about something, why dilly-dally!).
And so two became three. And we became weirdo parents.
Oliver, it turned out, was the perfect child for us: my friend Dave hit the nail on the head when he wrote, just yesterday:
I think their family is a miracle. Each of the three members in it are so different from each other, and yet each is uniquely qualified to communicate with the other two.
Lord knows what would have happened if we’d been cursed with a non-autistic child. It wouldn’t have worked out at all.
Oliver interviewed Catherine just before Christmas and asked her to sum up the last decade: almost all of the things she mentioned involved us travelling somewhere.
Some couples, some families, cannot travel together: often the first long trip shows fault lines that are never recovered from.
In our case, though, travel turned out to be something we were really, really good at, and all three of us enjoyed immensely. So we did a lot of it.
Three weeks in Thailand when Oliver was still nursing. A month in the south of France. Two weeks in Portugal, two weeks in Denmark, a summer in Berlin, a trip to the old country to tromp through Croatian graveyards, two weeks in Italy picking olives, a week in Oslo with my parents. Berkeley and Vancouver Island and Montreal and Thunder Bay and Regina for family weddings.
We made friends. From away. Imagine!
Friends in Sweden and Germany and Denmark and Italy and Portugal and the US and the Netherlands. Artists, writers, crafters, coders, thinkers, filmmakers. Friends who, despite the distances involved, we’ve forged strong links to. Many of them are watching us here today, from afar, on the web. (Hello friends!) And they’re joined by friends who wanted to be here but, for reasons of health of family or being snowed in up west, could not. (Hello other friends!)
It turns out that although by all appearances Catherine and Oliver and I had nothing in common, we did:
Curiousity turned out to be the engine of our family, and Catherine was the most curious of us all.
We had a lot of conversations over our years together that started out with me saying “Catherine, what would you think about going to …” and I don’t believe she ever replied with anything other than “of course, when do you want to go?”
The last trip Catherine took was with our friend Cindy, to Spain, in the fall of 2016. Technically she wasn’t able to travel: having incurable cancer means it’s almost impossible to get travel medical insurance. But she decided she’d just hold her breath and hope for the best.
After time in San Sebastian and Seville together, Cindy travelled onward and Catherine decided to remain in Bilbao for an extra week. She went out for tapas every night. She toured art galleries, went to art openings. One night she found herself at a fashion conference running her fingers over some material: a woman approached her and said “you look like you know what you’re touching.” What followed was an invitation to visit her studio, introductions to her vibrant group of friends, and a week immersed in a world so much both like, and unlike, her own.
Catherine’s curiousity was always getting her into scapes like that.
Those weeks that Catherine was away in Spain were difficult ones for me and Oliver, both because she was gone, but more so because Oliver had started high school that fall, and that proved to be a source of all-consuming anxiety for him. Every day I would drop him off at school and then drive home with tears streaming down my face because he was under such enormous stress. Our home life became a twice-daily father vs. son battle: convince him to get up in the morning, and then convince him to go to bed at night.
Finally, after one particularly stressful evening, an evening that that involved a lot of yelling by me and protesting by him, I stopped, sighed, and simply said “Oliver, please tell me what I can do to help you.”
“You need to be more like KD,” he told me.
And that was all we needed.
He carefully described to me what “being more like KD” meant. And I did what he told me. And that was the start of the way back to each other that we needed.
“You need to be more like KD” is advice we would all benefit from following.
Patient. Kind. Accepting. Calm. Generous. Daring. Colourful. Iconoclastic. Brave. Inclusive. Witty. Wise. Bossy, by times.
Catherine’s cousin Wendy said it well when she wrote me this week:
I reflected on my memories of Cousin Cathy: she was always older and cooler in every way. Most of my memories were at the farm, the cottage or visits to Toronto and involve my young self looking up to her with curiosity and wonder (you can show sheep? you can dye your hair red? you can be a glass blower? Art therapy is a thing? And so on). I am so grateful for these memories and the impact they had on my world view.
Who among us could not tell some version of that same story?
When Catherine and I were discussing this event, just two short weeks ago, she reiterated her wish that it be a secular one, and said there was no need to ask clergy to speak of things religious. Let me jump through a loophole in that arrangement and, for the first time in my life, quote the Bible; from James:
Consider it pure joy, my brothers and sisters, whenever you face trials of many kinds, because you know that the testing of your faith produces perseverance. Let perseverance finish its work so that you may be mature and complete, not lacking anything.
Living with cancer is hard. Treatments that kill you so that cancer doesn’t. Side-effects that have their own side-effects. Constant pain. Constant pain meds. Radiation. Enough calls to 911 that it became kind of commonplace. Birthdays and Christmases spent in hospital.
But despite all this, Catherine persevered at living like nobody I’ve ever seen. She refused to use the language of war: she wasn’t battling cancer, fighting cancer, defeating cancer. She was living with cancer. Beside it. Inside it. She neither let it define her, nor limit the possibilities she considered. She sought to offer comfort and support to others living with cancer, worked to spread the word that “palliative care” means “living in comfort,” not “about to die.”
It would be a lie to say our last five years wasn’t punctuated by stress and sadness and worry.
But that’s not all it was: we laughed, we ate, we celebrated birthdays and anniversaries, went to friends for supper or drinks, to Richard’s for fish and chips, to Star Wars on Christmas Eves. We also did the laundry. And took Ethan the Dog for walks. And paid taxes. Catherine made art, some of the best art she ever made.
Catherine opted to take the living part of living with cancer very seriously.
Catherine had a hard last month of her life: for a week after New Year’s she was in thrall of her pain medication, hallucinating, with tremors, unable to communicate clearly. But she found her way out of that, with a change in medication and a move to the Palliative Care Centre. And for a week and a bit, though she was tired and fragile and clearly edging toward the end, we could talk to each other again.
One night she was clear-headed enough to tell me how she felt:
“I feel content,” she said, “which surprises me. I didn’t expect to fell content. But I’ve done most of the things I set out to do in this life.”
She was, indeed, mature and complete and not lacking anything.
Catherine did not believe in God.
But I think she did God’s work.
Catherine and I may have, really, had no business being together.
But I am so thankful that we found our way to each other despite that.
Isaac and Perry Williams generously stepped in to provide everything that was needed to livestream the celebration of Catherine’s life yesterday, using Isaac’s very keen livestream rig.
The video was streamed through YouTube, which seemed to work well for all concerned; however because there was recorded music before and after the formal event, YouTube’s copyright robots immediately fired off nine copyright claims from rights holders (for the songs Nessun Dorma, You And I (Vinceremo), Amazing Grace, Viento, Lullaby (The Smile Upon Your Face), Forever Young, Lead With Your Heart, Anchor Me, and Mañana).
To mitigate the chance of rights holders running advertising against Catherine’s celebration, or YouTube arbitrarily deciding to remove it, I’ve downloaded the video and uploaded it to a server that I control, and you can watch it here.
The YouTube livestream allowed for live chat among the viewers, and I’m preserving that here for posterity too:
- Luisa Carbonelli – Malmö folks (Jonas B, Olle and I) are gathering here at our flat. The sun setting early here today in southern Sweden.
- Elmine Wijnia – checking in
- Henriette Weber – I am online from Helsingør - hi guys
- itoobutoob – Oliver B in Portland, Oregon
- Morgan Roderick – Checking in from Las Palmas
- jypsy norman-bain – Sending love & warm wishes ❤
- Ton Zijlstra – Just returned home from work, and now online from Amersfoort as well.
- thelyvision – Sending love and light to all from Thelma in western PEI.
- Juliane Röll – Hello all. Dresden, Germany here.
- Juliane Röll – Are you receiving sound transmission? (I receive the video feed, but no sound.)
- Morgan Roderick – no sound yet
- Morgan Roderick – I assumed it to be intentional
- Ton Zijlstra – Assuming the same, the celebration hasn’t started yet it seems.
- Cheryl Green – Hello, all. Cheryl in Portland, OR
- Juliane Röll – Allright. Thank you!
- Morgan Roderick – There is sound!
- Joan Sinclair – Joining you all now from Stanley Bridge, PEI
- Pedro Custodio – Hello all from far Indonesia. Strong hug 😢😘
- Ton Zijlstra – hi Pedro, you too a big hug
- Brian Bauld – My candle burns at both ends; It will not last the night; But ah, my foes, and oh, my friends— It gives a lovely light. Edna St. Vincent Millay
- Ton Zijlstra – That was beautiful. Grateful for the live stream.
- Anna Keenan – Sending love to all. A beautiful service for a powerful woman. Thank you for sharing her stories and lessons in this way.
- Morgan Roderick – It was nice to be able to participate from afar. Thank you
- Cynthia King – Thank you for streaming. Love to all. A celebration of a beautiful person.
- Elmine Wijnia – Luisa: you’re wearing the perfect dress for today.
- Ton Zijlstra – Indeed, you do Luisa
- Elmine Wijnia – grateful to have joined you. it’s nearly dark here. time to sign off.
- Ton Zijlstra – Warmth to all. Signing off.
YouTube also provided analytics about the number of concurrent viewers:

(Video of the Celebration of Catherine’s Life is here)
Welcome to this celebration of the life of our dear Catherine. We are here, in this place, because Catherine chose it. She wanted there to be words, and music, and food, and more joy than sorrow.
The structure of today’s celebration flows from Oliver’s mind, which takes great pleasure in grouping time into eras, in this case “childhood,” “young adulthood,” and “now” (an era that starts, logically, with his birth!).
– Marina, Peter and Oliver
“Childhood”
Age 0 to 15 (1963-1978)
- Archdeacon John Clarke, Welcome and Prayer
- Jim Kerr (Uncle)
- Michael Pendergast, Caledonia (Dougie MacLean, 1977)
“Young Adulthood”
Age 16 to 36 (1979-1999)
- Ann Thurlow
- Silva Stojak
- Tony Reddin, Big Yellow Taxi (Joni Mitchell, 1970) – singalong
“Now”
Age 37 to 56 (2000-2020)
- Oliver Rukavina
- Peter Rukavina
- Roy Johnstone, Niel Gow’s Lament (Niel Gow, 1805)
The celebration continues, afterward, in St. Paul’s Parish Hall, next door, with food, tea and coffee, some tunes, and a chance to chat. This portion will, alas, not be webcast.
Thank you to all who helped make today possible.
About This Blog
 I am Peter Rukavina and this is my blog. I am a writer, letterpress printer, and a curious person.
To learn more about me, read my /now, look at my bio, listen to audio I’ve posted, read presentations and speeches I’ve written, see things I’ve favourited elsewhere, or get in touch (peter@rukavina.net is the quickest way).
I have been writing here since May 1999: you can explore the 25+ years of blog posts in the archive.
![]() You can subscribe to an RSS feed of posts, an RSS feed of comments, an RSS feed of favourites elsewhere, or a podcast RSS feed that just contains audio posts. You can also receive a daily digests of posts by email. I also publish an OPML blogroll.
You can subscribe to an RSS feed of posts, an RSS feed of comments, an RSS feed of favourites elsewhere, or a podcast RSS feed that just contains audio posts. You can also receive a daily digests of posts by email. I also publish an OPML blogroll.
Instagram • YouTube • Vimeo • ORCID • OpenStreetMap • Internet Archive • PEI.art • Drupal • Github.