I’ve been a Jane Siberry fan for as long as it’s been possible to be so, and it’s not an exaggeration to say that no musician has been more influential in my life over the course of the last 35 years.
And yet, after seeing her play live at Ontario Place, and then again at Victoria Hall in Cobourg, both in the late 1980s, I hadn’t had a chance to see her perform for the last three decades.
But last night she played Harmony House in Hunter River and I had a seat in the front row.
It was a unique evening.
I’d imagined myself to be the only Jane Siberry fan on Prince Edward Island: from the size and ferocity of the audience, this is clearly not the case. To my surprise, there were many who I’d consider part of my not-too-distant-extended-community in the house last night, people I’d never considered I might have this in common with. It was a good reminder that commonality is often hidden behind closed doors.

And it was a weird concert: a kind of aural patchwork quilt of sounds and stories that appeared, initially, to be too random and too slapdash but that, over the course of the evening, shimmered into something larger. It was really quite delightful to witness and be a part of.
At the end of the evening Jane offered up three of her paintings for sale–”I can’t take these on the plane with me”–and the one you see between her guitar and her feet, right in my eyeline, was the one that caught my eye (when it’s not rendered in black and white it’s all manner of orange, green, red and blue). So I waited until the crowds had cleared, offered her all the money in my wallet, and we had a deal.

A good night.
Earlier in the year, in response to a post I wrote about salted capers, Jeremy Cherfas left a helpful comment.
Jeremy had found his way here, across the ocean from his home across the sea, via Ton’s link to my post about editing OpenStreetMap.
In the process of figuring out who this Jeremy was, and why he knew about capers, I came across his Annual Report for 2018, which he started with:
Monthly reports have been going more than a year now, even if I have missed a few, including last December. What to add for an annual report? I think this has to be a different kind of beast, more like a GTD high-level view. But there’s still room for some low-level stuff, down at the bottom, thanks to Exist.
I followed that link to Exist and found, on the other end, a delightful Australian project that enables one to aggregate personal analytics and, in theory, to gain insights:
By combining data from services you already use, we can help you understand what makes you more happy, productive, and active.
Bring your activity from your phone or fitness tracker, and add other services like your calendar for greater context on what you’re up to.
Both as a researcher and someone increasingly prone to seeking insight, this was a good tree for me to bark up, and I immediately started a trial, converting to a paid subscription after the 30 day free window. I’ve been using Exist every day since, and I’m just now, after 4 months, starting to see the faint glimmer of useful insights on the horizon.
Here’s a taste of what I track in Exist.
The Android phone in my pocket is running Google Fit, which counts the steps I walk each day.
I can see my steps per day, averaged by the week (the harshest part of winter was not good for my activity level):

I can see which days of the week I’m most active (there’s a clear pattern here, with my activity level falling over the course of the work week, and then picking up on the weekend):

And I’m given a set of correlations between steps and various other things that I’m tracking. For example, I use Exist’s “custom tracking” feature to mark days with various tags of my own choosing. I use “Receiver” on days I visit Receiver Coffee, for example, “Lunchathome” for days when I eat lunch at home, and “Napeve” for days when I have a nap in the evening:
![]()
These charts tell me things like “I walk more when I travel” (common sense) and “I walk more when I don’t have a nap in the afternoon or a nap in the evening” (good to know).
Because I don’t wear a fitness or sleep tracker, but wanted to track my sleep, I used the Exist API to code up a tiny web app to allow me to manually enter my bedtime and wake time each day.
![]()
I’ve been tracking my sleep for two months now. The bump in late March and early April was due to vacation and work travel where, apparently, I get about an hour more sleep a night (I didn’t know that).
The bottom chart confirms that I sleep an extra hour on the weekend, that I get an average of 7:30 a night, and that I sleep a little more on Thursdays (for reasons unknown).
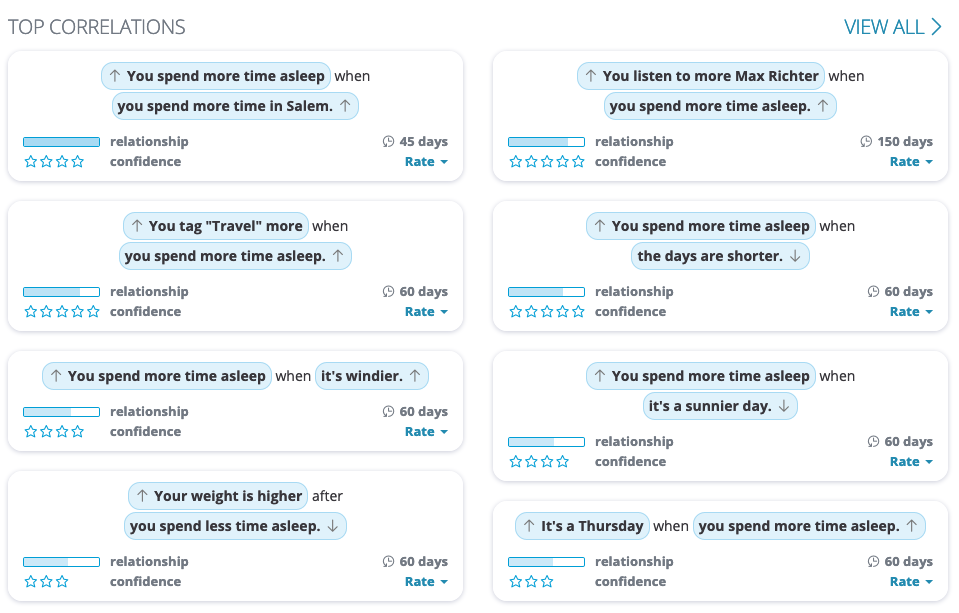
The sleep correlations that are surfaced are a combination of the not-very-useful (I may spend more time asleep when I’m in Salem, but I was only there for a single night), the curious (why do I sleep more when it’s sunnier?) to the delightful (the Max Richter album I have downloaded on Spotify is his eight and a half hour Sleep, “a piece that is meant to be listened to at night”; obviously it works).
I bought a Withings wifi-enabled scale in January when it was on sale, and I’ve been measuring my weight at the same time every morning, about 30 minutes after I get up.

I think the readings in early January were an aberration caused by my entering a best guess for my starting weight into the Withings app, so it’s really only the week of January 27 onward for which I trust the data.
There’s not much to be gleaned from Exist’s attempts to correlate my body weight to other things, perhaps because it’s remained relatively consistent. It does tell me “your weight is higher after you’re not listening to music,” and “your weight is higher after you don’t tag Travel,” which are intriguing. Body weight, I think, is something best analyzed over a longer window than a season, so I’ll keep at it; certainly the ease of the wifi scale makes it dead simple to do so.
Another thing Exist is well setup to allow me to track manually is my mood. It’s a relatively blunt instrument, with only 5 gradations. And I’m not sure I’d ever dare to tag a day with a rating of “1,” as that would admit the depths of complete despair. But after 131 days of tracking my mood, I find myself surprised by the results:
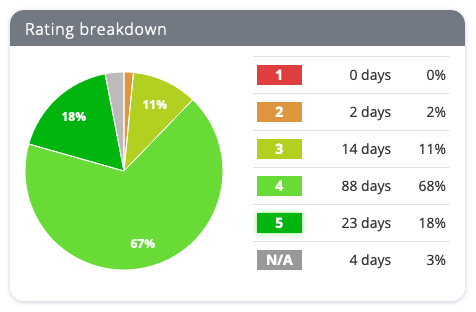
I’d been under the impression, perhaps because I’ve had a good run of mood, that I’d tracked almost every day as a 4, but, I learned from this chart, that only happens 68% of the time; 18% of the time I have a “perfect” day, and 13% of the time I rate my mood a 2 or a 3.
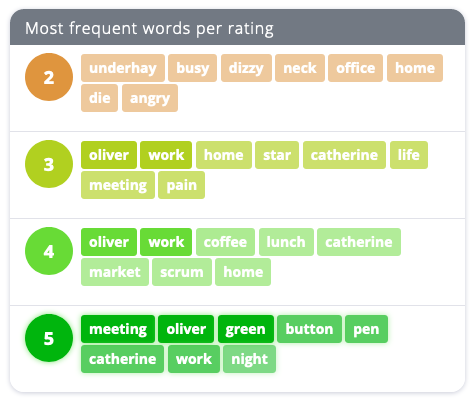
Along with entering a numeric mood rating, Exist also prompts me for some words or phrases to explain my mood; I found the aggregation of this really interesting:
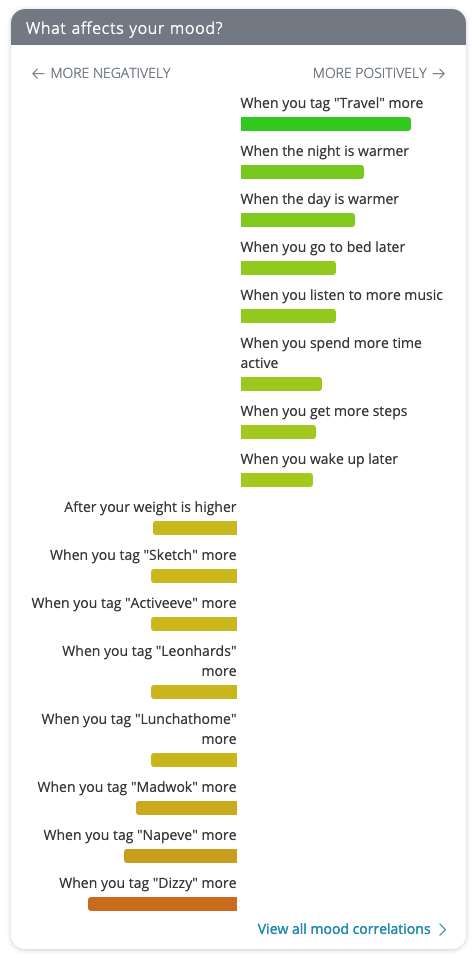
The closest that Exist comes to out-and-out recommendations for lifestyle changes is the “What affects your mood?” chart.
Following its advice I should travel more, to warmer places, stay up late, listen to music, stay active and sleep in, and I should avoid sketching, going to Leonhard’s for coffee, eating lunch at home, eating at Mad Wok, having a nap in the evening, and being dizzy.
While Exist is primarily tailored to allowing me to compare me to myself, it does occasionally venture into letting me know how I compare to the global average for all Exist users:
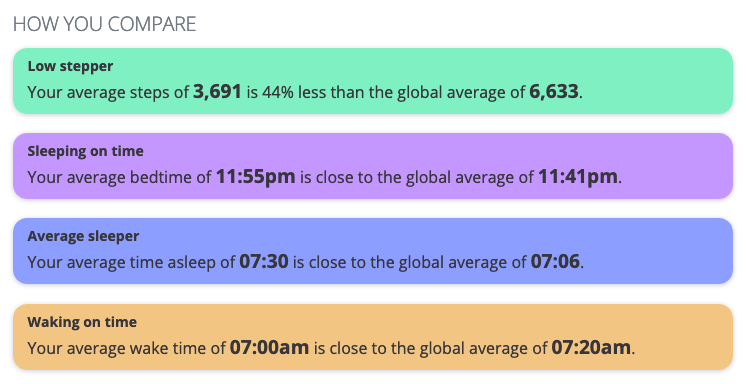
So I’m more sedentary than others (warning sign), but I go to bed and get up around the same time as everyone else, and sleep just a tiny bit more than average.
Beyond the joy of measuring, I enjoy using Exist because of the small team behind it, their sense of design, their openness to openness, their blog, and their quick turnaround for addressing support questions.
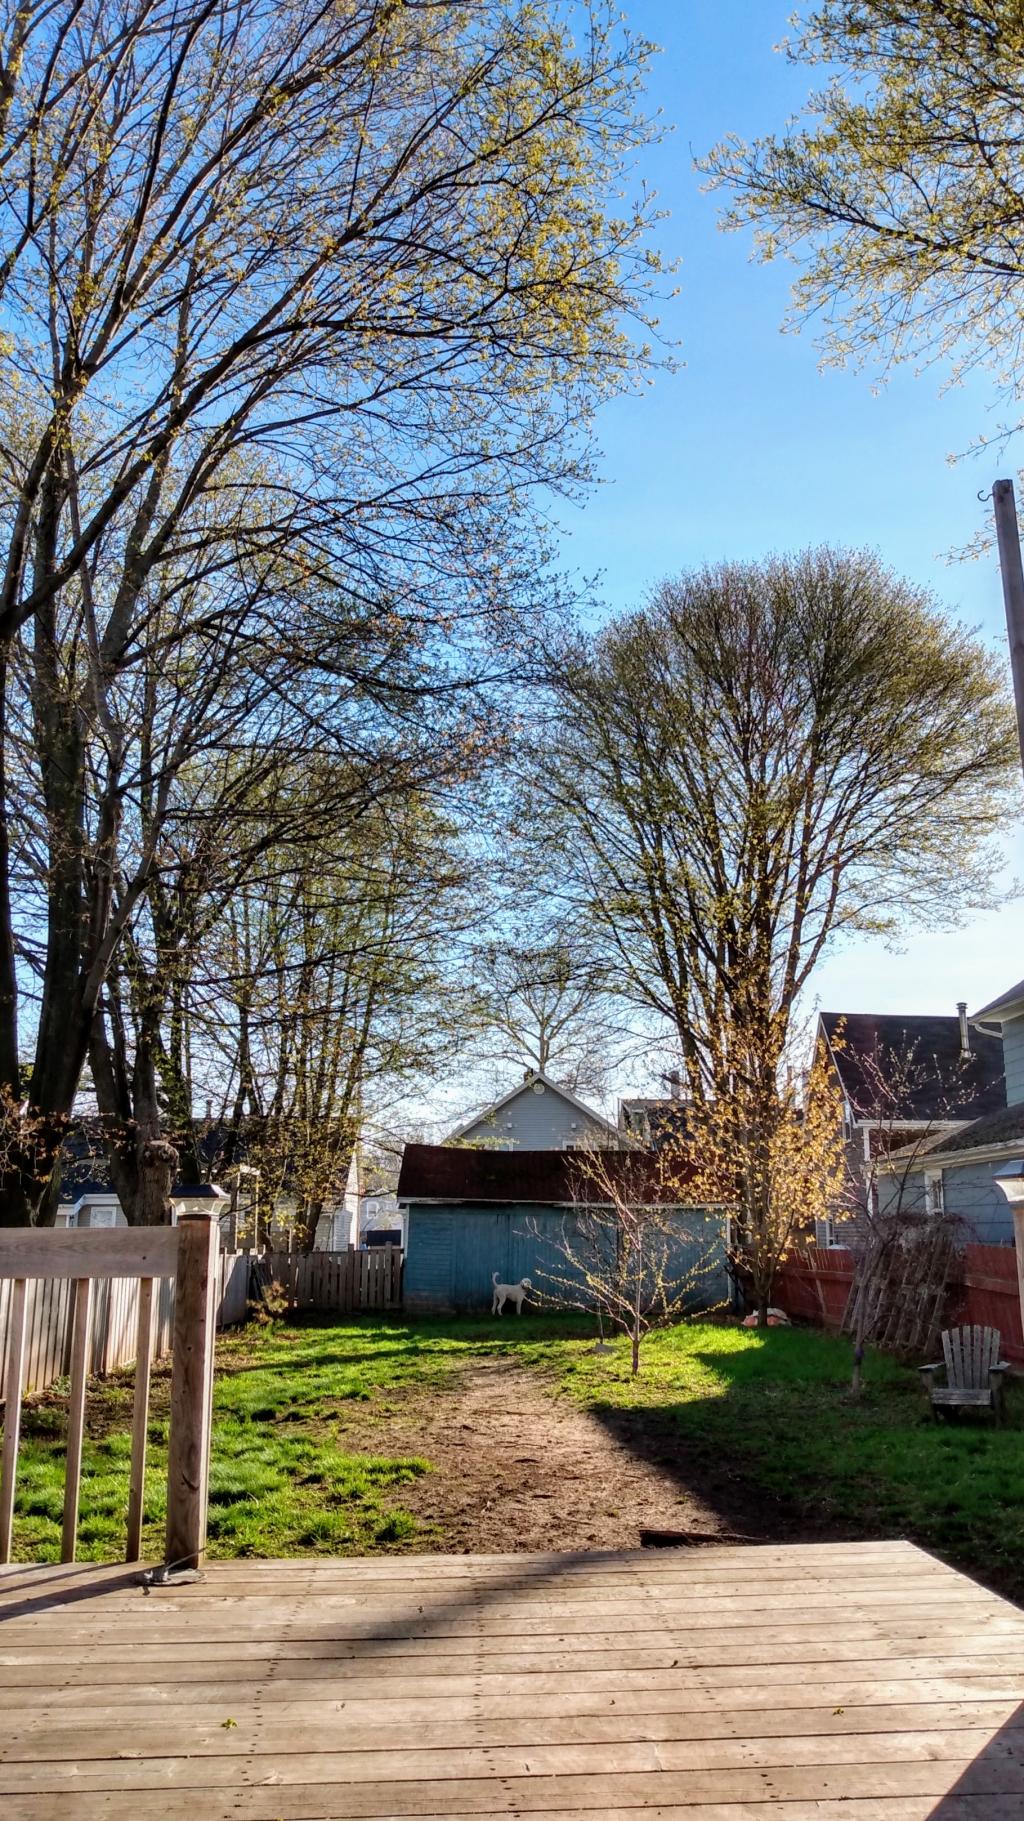
After seeming weeks of ceaseless rain, we woke up to sunshine this morning.
And the trees reacted by bursting out buds.
I don’t believe the winter-spring transition has ever been as clear cut as this: yesterday the sky was dark and the trees were midwintery; this morning there is life everywhere you look.
I often trace my interest in letterpress back to my 2010 visit to Berlin with Oliver and the numerous printing exhibits we found in the museums of the city. But, in truth, my first taste of letterpress came much earlier, when, in the late 1990s, I had business cards made for Digital Island, the name of my company at the time.
I’d somehow made contact with Fred Louder, who’d recently relocated from Montreal to O’Leary, with his press in tow; I was so inspired by what he showed me that I asked Fred if he would create business cards for me, and he generously agreed.
The resulting cards, printed on a rainbow of lovely, toothy paper, are works of art.

Digital Island is, of course, no longer Digital Island. And we no longer live in the New Haven 675 exchange. So the cards have receded out of utility and into examples of the craft and memories of the way things used to me.
Frances Ann Squire was Oliver’s teacher in grade 9. Today it was announced that she’s been recognized with a Prime Minister’s Award for Teaching Excellence. So now everyone else can come to know what Oliver has known for years: she is a skilled, dedicated, innovative educator.
“Trust grows when you take time to understand the thoughts and feelings of others before you act.”
So starts the third chapter of The Right Honourable David Johnston’s book Trust: Twenty Ways to Build a Better Country. He continues:
My grandmother told me that people were given two ears and just one mouth for a good reason: we should listen before we speak. She was a wise woman and an early proponent of what we refer to now as emotional intelligence. While that term gets bandied about quite a bit these days, emotional intelligence at its core is the simple act of listening to and empathizing with another person—and using that listening and empathizing to inform your decisions and actions.
His Excellency’s motto as Governor General was Contemplare Meliora – To envisage a better world – and this book is an surprisingly useful guide to doing just that.
In December 2018, at great expense and complexity, we insulated our attic, removing decades old asbestos insulation and replacing it with R40 of blown fiberglass.
Did it help our energy consumption?
Here’s a comparison of our 2018 and 2019 winter season oil bills:
| Month | 2018 Oil Usage (litres) |
2019 |
Change in |
|---|---|---|---|
| January | 541 | 527 | -3% |
| February | 914 | 937 | +3% |
| March | 452 | 418 | -8% |
| April | 505 | 471 | -7% |
| TOTAL | 2,412 | 2,353 | -2% |
Oil usage information alone doesn’t account for differences in heating due to differences in the weather; with the help of Efficiency PEI, I determined that there were 2,391 heating degrees days in the first four months of 2018, and 2,567 heating degree days in the first four months of 2019, suggesting that, all other things being equal, we would have used 7% more oil in 2019 (about 2,580 litres).
But we actually used 2% less oil, so our net oil savings due to insulation was closer to 9%.
Our home heating oil cost, because of the increase in the price of oil, doesn’t reflect savings, but rather a 2% increase:
| Month | 2018 Oil Cost |
2019 |
Change in |
|---|---|---|---|
| January | $491 | $481 | -2% |
| February | $806 | $875 | +9% |
| March | $405 | $400 | -1% |
| April | $467 | $463 | -1% |
| TOTAL | $2,169 | $2,219 | +2% |
Had our consumption not dropped due to insulation, we would have spent about $2,348 on oil in 2019, meaning our net cost savings was about $129.
From Fairphone: The most sustainable phone is the one you already own. In part:
A phone’s biggest environmental impact comes from the manufacturing process. That’s why – whether it’s a Fairphone or something else – the most sustainable phone available is the one you already own. So the longer you keep it, the more sustainable it becomes. Extending the lifespan of existing phones is the best strategy for reducing their impact on the planet. And it’s not only good for the earth – it’s easy on your wallet, too!
While keeping our 2000 Volkswagen Jetta has been mostly due to frugality and limited resources, I do take some pride in having not needed to cause another car to be created to replace ours.
Seth Godin on digital hygeine:
The solution is fun and simple: find a smart person and have them watch you use the computer for an hour.
She’ll share ten shortcuts and principles that will amaze you.
And then you can return the favor.
I did, albeit less intentionally, with Olle several years ago, the big payoff of which was turning off email notifications; this has improved my productivity and reduced work stress.
Last month I watched Josh MacFadyen use QGIS in a coffee shop for 15 minutes and I’ve been using what I’ve learned to great effect ever since.
Manitoba fiddler Patti Kusturok accompanied by multi-instrumentalist Jeremy Rusu at the National Fiddling Day celebration at St. Paul’s Anglican Church on May 18, 2019. Sound engineering in the hall was by Brent Chaisson; I plucked this sound from the back of the church with my phone.
 I am
I am