One of the downsides to lacking a fuller formal education is that I don’t recognize concepts from Shakespeare. But fortunately I can Google them. And this is a lovely one (it’s from Henry IV, Part 2). The snippet below is from an excellent article on squash (and aging, and fatherhood) by Tad Friend in the January 18, 2016 issue of The New Yorker.

Also, I turn 50 in twenty days. So it’s timely.

🗓️

On the way back to town from the dentist in Cornwall this afternoon we spotted a new shop, Natural Power Solar Products, in the plaza across from the post office. Curiousity got the best of of us, and we popped over for a look.

IMG_20160314_123712

Inside we found owner Shirley Han, and an array of solar things, the most prominent of which, on display in the middle of the shop, was a portable solar kitchen — Kitchen of Wonderland reads the brochure:

Solar Kitchen Brochure

It’s an intriguing product, one that brought back memories of trying to build a solar-powered bread oven at reboot in 2009. They have a large unit in stock, with smaller ones on the way; pricing seems to be in the $300-$600 range, although that needs to be worked out once everything is through customs.

It’s hard not to fall for the infectious bravado of the brochure – “This creation may be greater than Steve Jobs’s iphone” – especially if the reported 3-6 minutes for popcorn popping is accurate. I’ve encouraged them, once the warmer months arrive, to attract customers by setting up a unit in the parking lot: there’s steady traffic from the grocery store next door.

In addition to solar kitchens, they also sell “power banks” that you can charge from a solar panel or from the mains that you can then use to power a mobile phone or tablet, and there’s a larger array of solar products en route from China as we speak, due to arrive soon.

We’ve been beneficiaries of new restaurants and grocery stores in the Charlottetown area from the wave of Asian immigration over the last decade; it’s great to see new initiatives like this that fall outside the food realm.

🗓️
Solar  •  Cornwall  •  China

A capability heretofore unavailable to we Canadians had recently been enabled for Android: identifying music that’s playing.

If you say “OK Google” (or tap the speaker icon on the home screen), if there’s music playing a musical note icon will appear: tap it and Google will, Shazam-style, attempt to identify the track.

🗓️
Music  •  Android  •  Shazam

Did you know there’s a “Capital Area Transit Coordinating Committee” here in the Charlottetown area? It’s made up of representatives of the municipalities of Cornwall, Charlottetown and Stratford as well as T3 Transit (the transit operator). They meet regularly to, well, coordinate transit in the capital area. And this morning I had the pleasure of speaking to them about my efforts as a volunteer to get transit data into the GTFS format so that it can be made available both as open data and in venues like Google Transit.

The were a welcoming group, enthusiastic about what I had to show; I left the meeting with their collective support, and with an agreement from Cornwall and Stratford to allow their schedule information to become part of the effort. 

🗓️
Public Transit  •  Charlottetown  •  Cornwall  •  Stratford

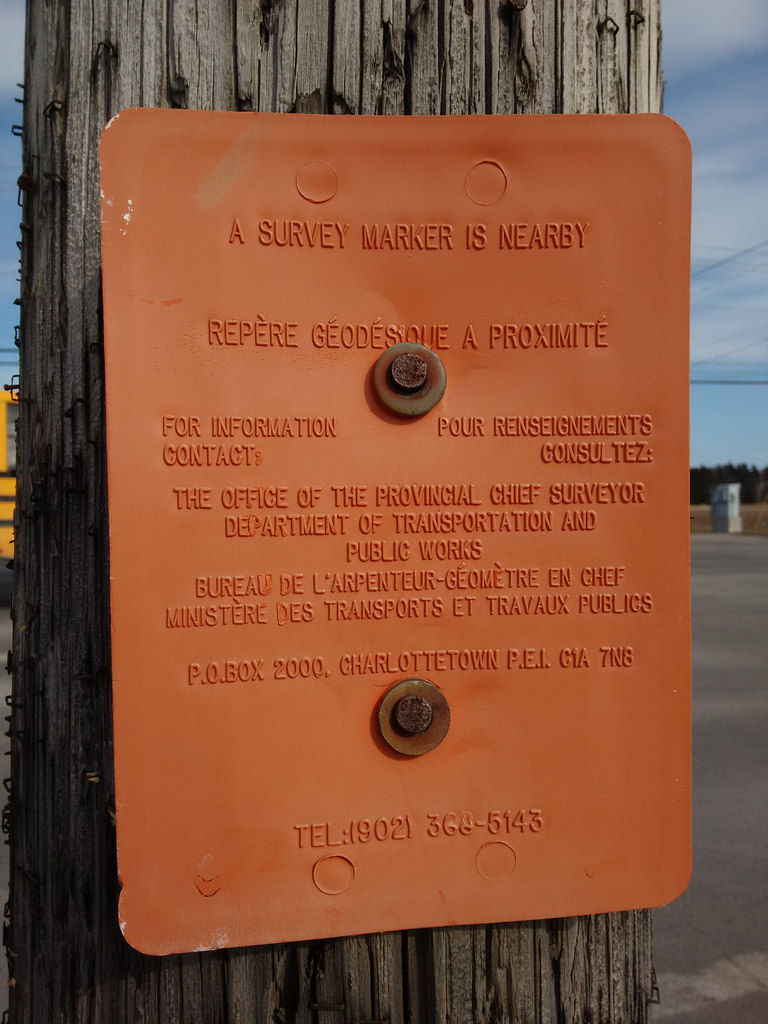
These signs, found on utility poles across Prince Edward Island, are so wonderful. They’re designed to weather the elements, to be obvious, and to never wear out.

A Survey Marker is Nearby

There are 4,746 survey monuments in total on Prince Edward Island  The Province has a page that describes their role:

Prince Edward Island’s survey control network is made up of about 4000 stations placed in strategic locations throughout the province. Each station typically consists of an inscribed brass cap placed on top of a concrete pillar buried to ground level with a sign post located about 1 metre away. This network of stations provides security of land tenure for all Islanders. For more than 30 years, land surveyors have referenced their surveys to these stations to ensure that property boundary markers found or placed are accurately recorded on a plane mapping surface and can be relocated with great certainty should these marks become lost or disturbed.

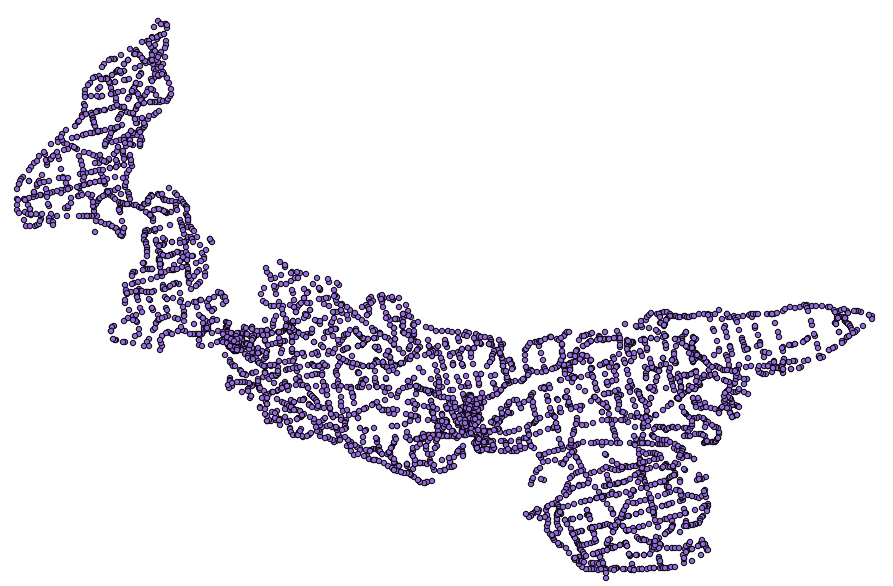
You can download a GIS file of all of them if you’re interested. You don’t even need a coastline file to view the monuments, as they describe the Island pretty much by their collective footprint:

Survey Monument Map of PEI

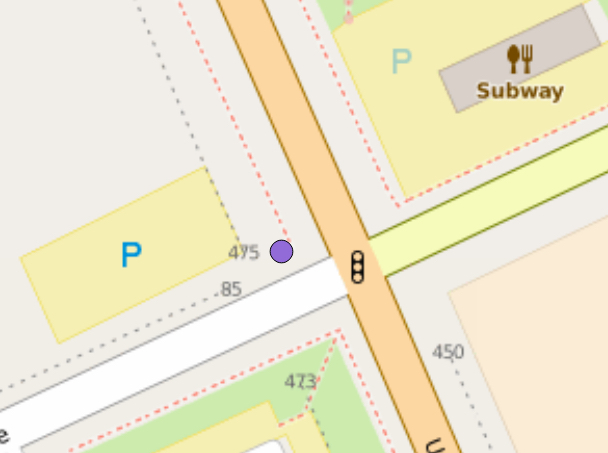
And, sure enough, right on the map where the sign was found, at the corner of University Ave. and Belvedere, there’s a marker:

Marker at University and Belvedere

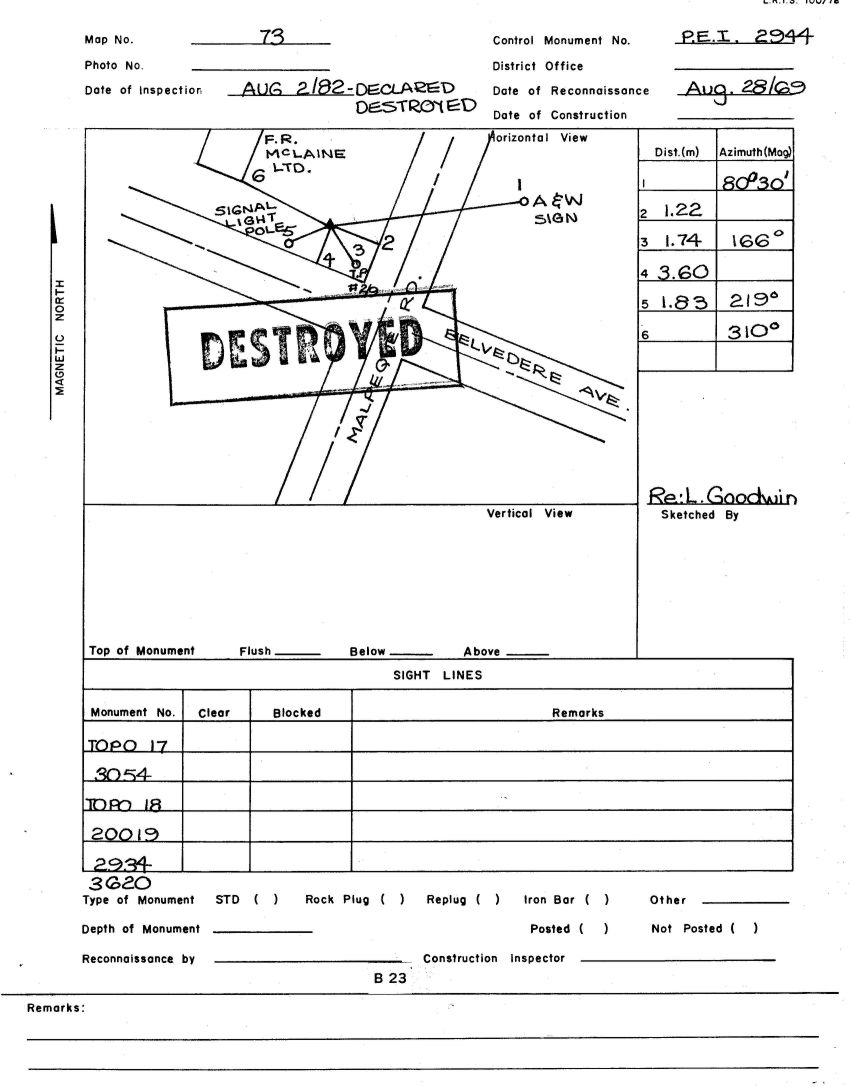
Turns out that it’s monument number 2944, which has a web page all its own. That page includes a sketch of the monument’s location, and that sketch is stamped with a big DESTROYED:

Marker 2944 Destroyed

So while the signs might be wonderful, they are also, it seems, sometimes inaccurate. 

The printing on the sketches is wonderful too, by the way: it’s almost worthwhile enough to consider becoming trained as a surveyor simply for the printing improvement it would bring.

Postscript: when you call the number on the orange survey monument sign, you are calling the Chief Surveyor themselves. This is Prince Edward Island, after all.

🗓️

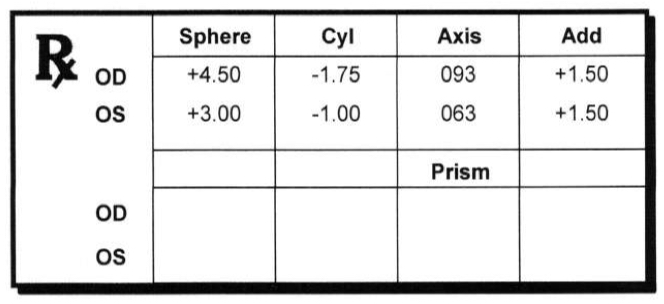
Here’s my latest eyeglasses prescription, based on an eye exam this morning at Charlottetown Vision Care:

Glasses Prescription

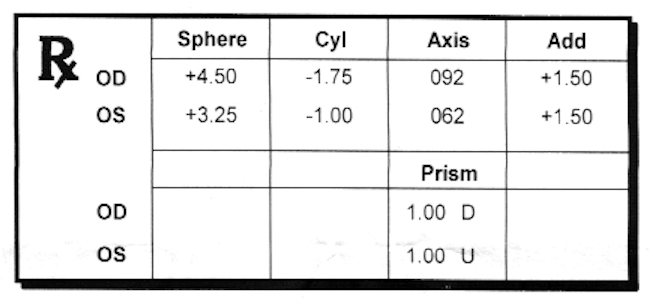
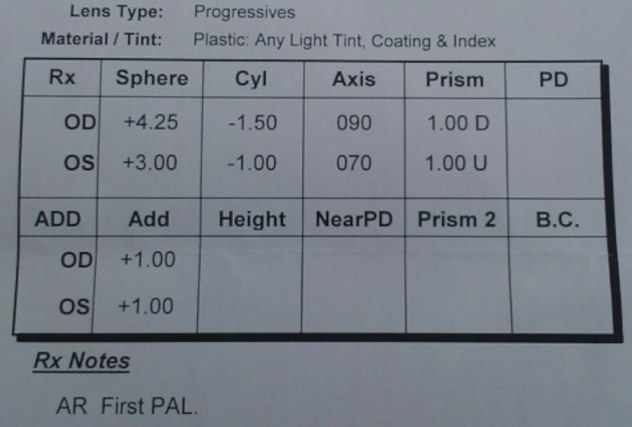
Here’s my prescription from 2014, one I never had filled (progressive lens are expensive!):

2014 Eyeglasses

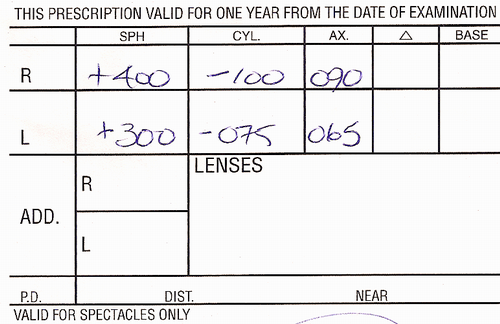
And the prescription from 2012, which I’m still wearing:

2012 Glasses Prescription

And the prescription from 2008, the one that stood me in good stead when I found myself stepping on my glasses in Ontario: 

After skipping a cycle, I’m off to get the new prescription filled this week, as the “which looks clearer, this… or this…” tests I did with Dr. Judson today showed a marked improvement over what I’m wearing now. I’m also going to get a pair of “computer” glasses, optimized for desk work, to avoid the neck strain I’ve been having since I started wearing bifocals.

🗓️

I took the bus up to Charlottetown Vision Care this afternoon for my biennial eye exam. Afterwards, finding myself uptown I decided to pop in at the PEI Home and School Federation office and, after that, decided to take the shortcut through the fence to Wendy’s for a quick bite before heading back downtown.

For the first time ever I ordered the Broccoli Cheese Baked Potato, a menu item I’d never had before. I’m not sure why I did this; perhaps it was a drive to expand my horizons. Upon further analysis, post-eating, I feel my horizons should stay where they are, Wendy’s-wise, as this was, in essence, a baked potato slathered in molten Cheese Whiz. 

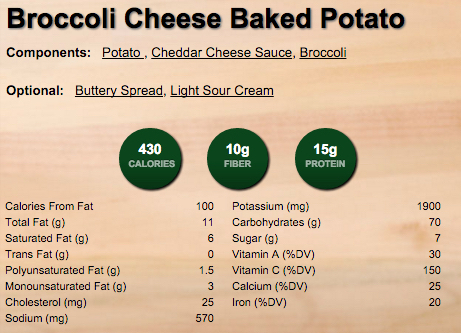
It also, I found upon return to the office, is a menu item of 430 calories:

Broccoli Cheese Baked Potato Nutrition Information from Wendy's

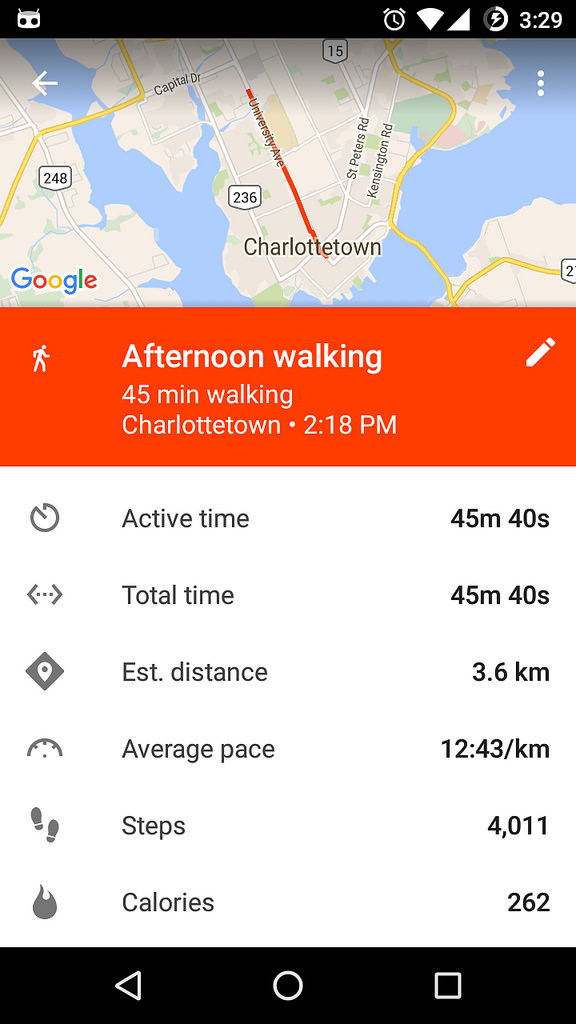
As I headed out the Wendy’s parking lot for the walk back downtown, I started recording my trip in Google Fit. When I reached downtown I ended the activity, and found that a walk from Wendy’s to downtown Charlottetown consumes, by Google Fit’s rough figuring, 262 calories. Or only 65% of the Broccoli Cheese Baked Potato. And even that cannot erase the memory of swimming through Cheese Whiz valley.

Walking from Wendy's to Downtown

Walk and learn.

🗓️
Walking  •  Wendy's  •  Nutrition

🗓️

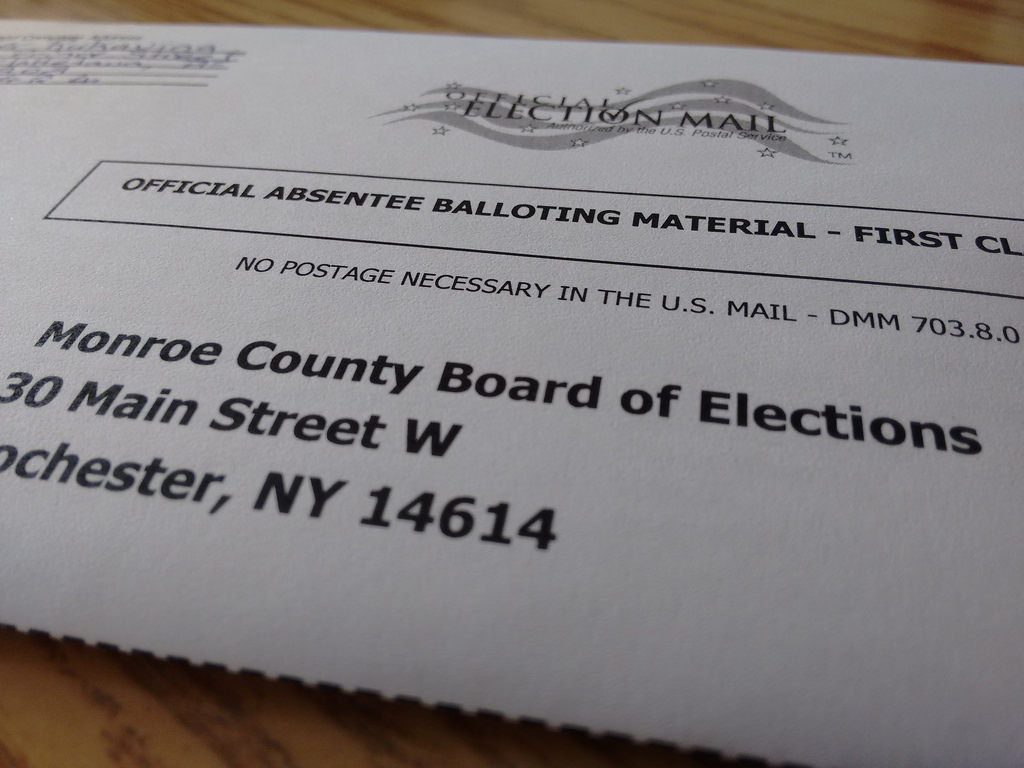
I received an email from the Monroe County Board of Elections earlier this week that my ballot for the April 19, 2016 Presidential Primary was available for download. I logged in – using credentials I’d established in the last election cycle – and downloaded both the ballot and the two envelopes (one to be placed inside the other) needed to return it by post. I’m off to the post office at lunch to mail it off.

My Absentee Ballot Envelope of the New York State Primary

🗓️

Today was my final lecture of four in the Philosophy 105 course I’ve been guest-teaching this winter (see reports from lectures one, two and three). I’ve taken the students on a diversion from the regular text and the regular path through the “philosophy of technology, values and science” so today was an opportunity to try to knit the various tangents I’d gone on together. As my overarching goal for my four lectures was to drop into the world of “open” – source, data, government, society – as a philosophical approach to technology, using my own experiences as a jumping off point, I opted to use OpenStreetMap, the open project I’ve spent the most time lurking in, as the focus for today. And so we opened with The Map:

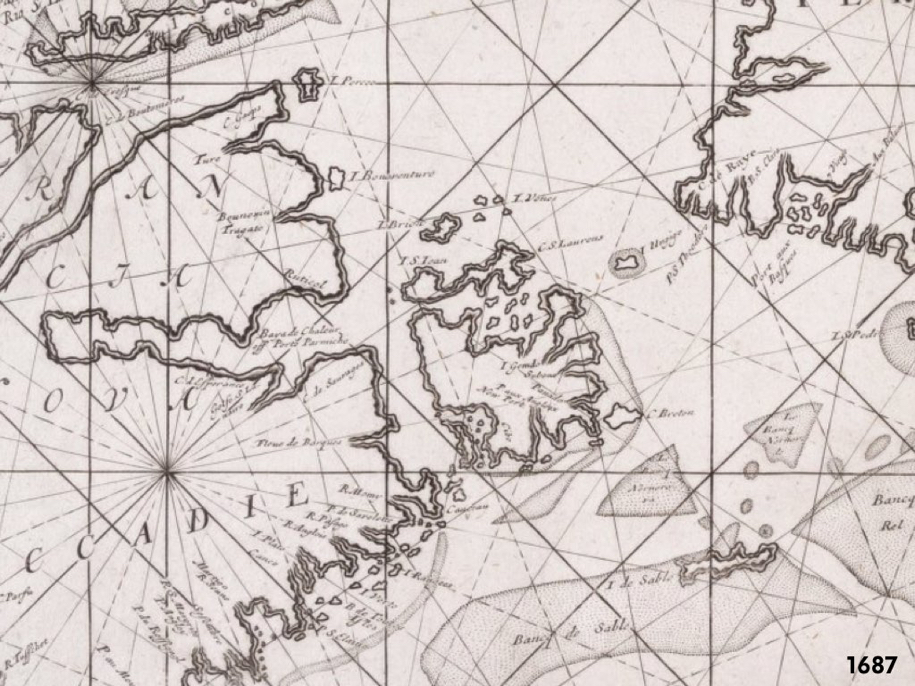
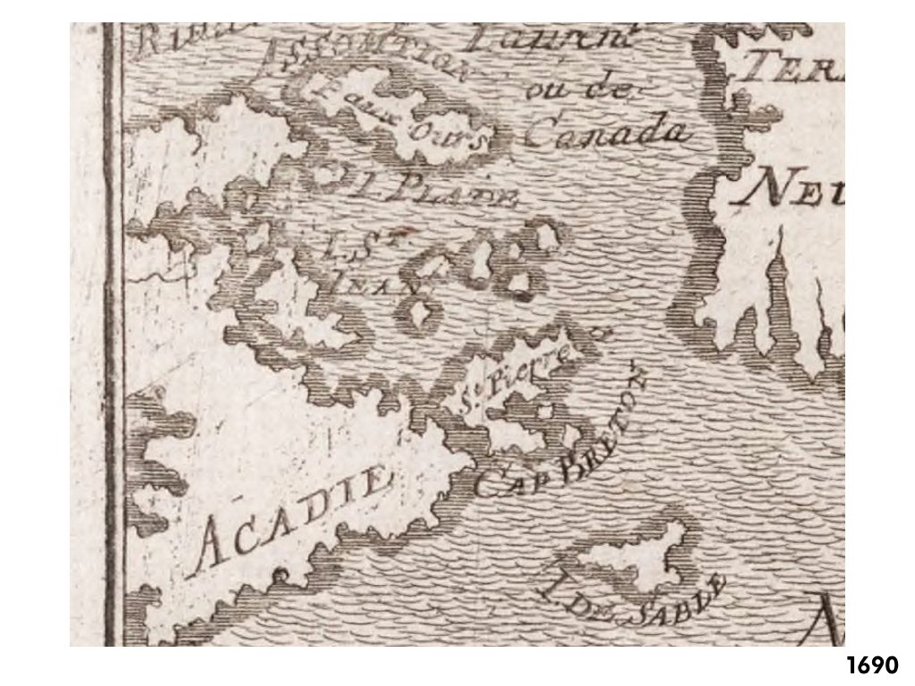
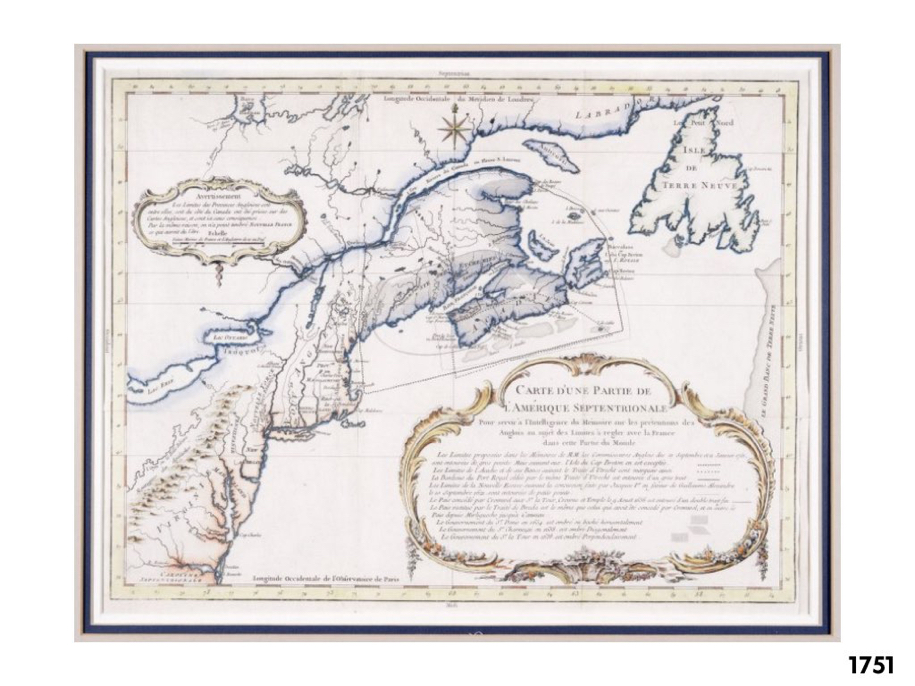
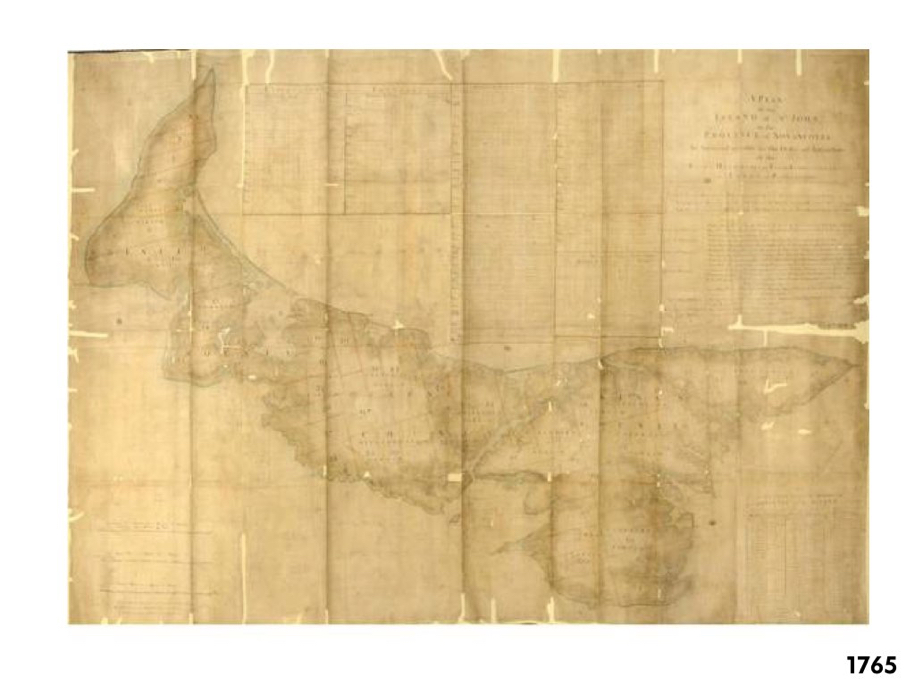
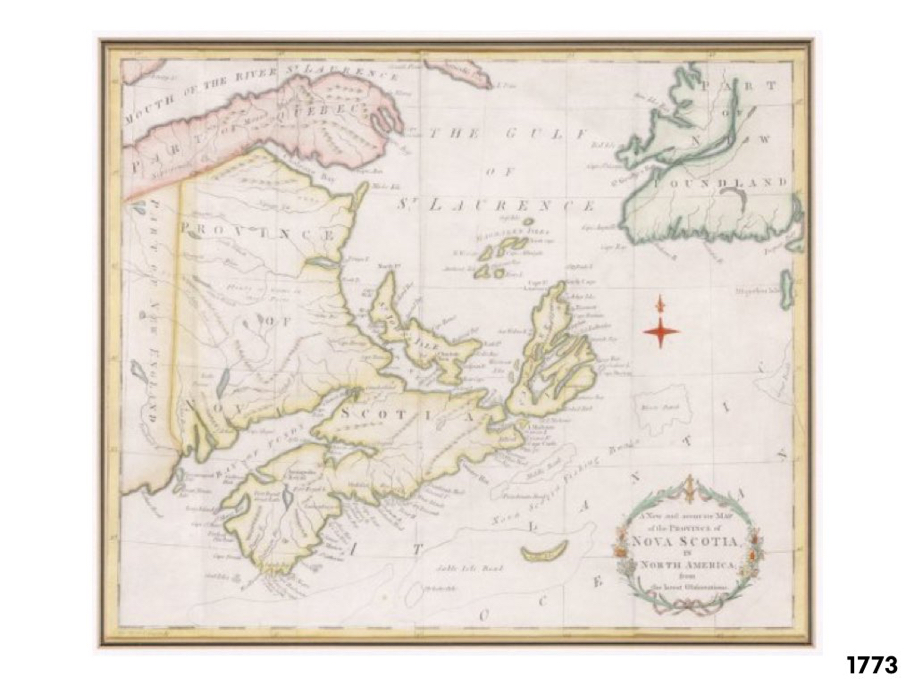
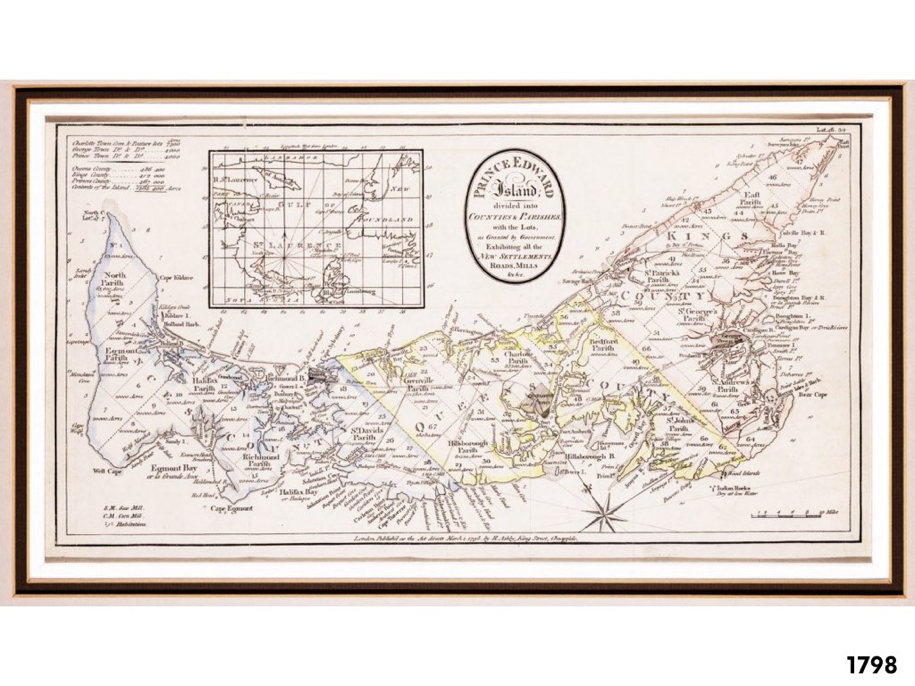
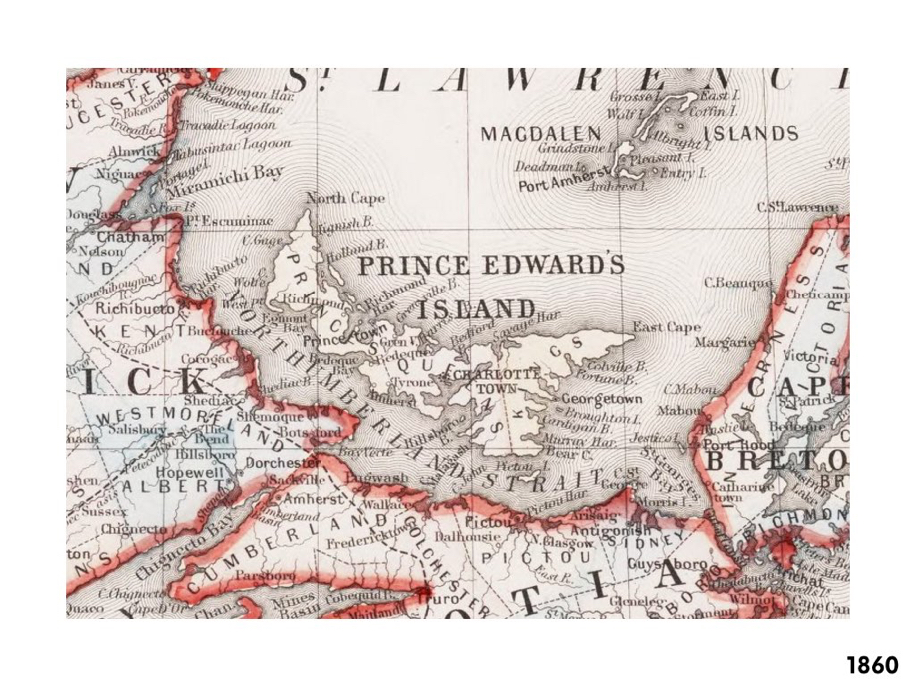
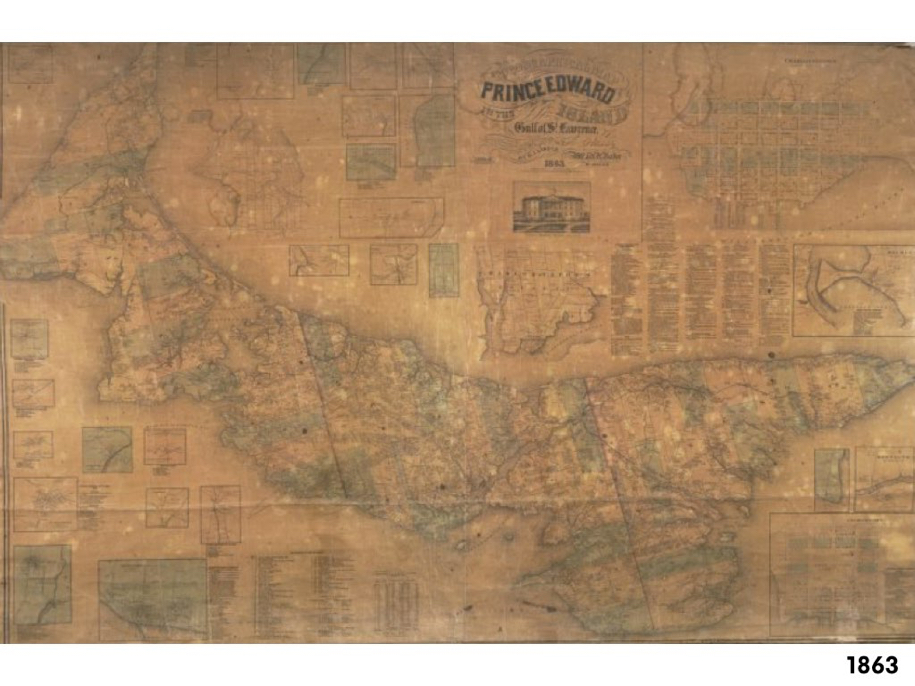
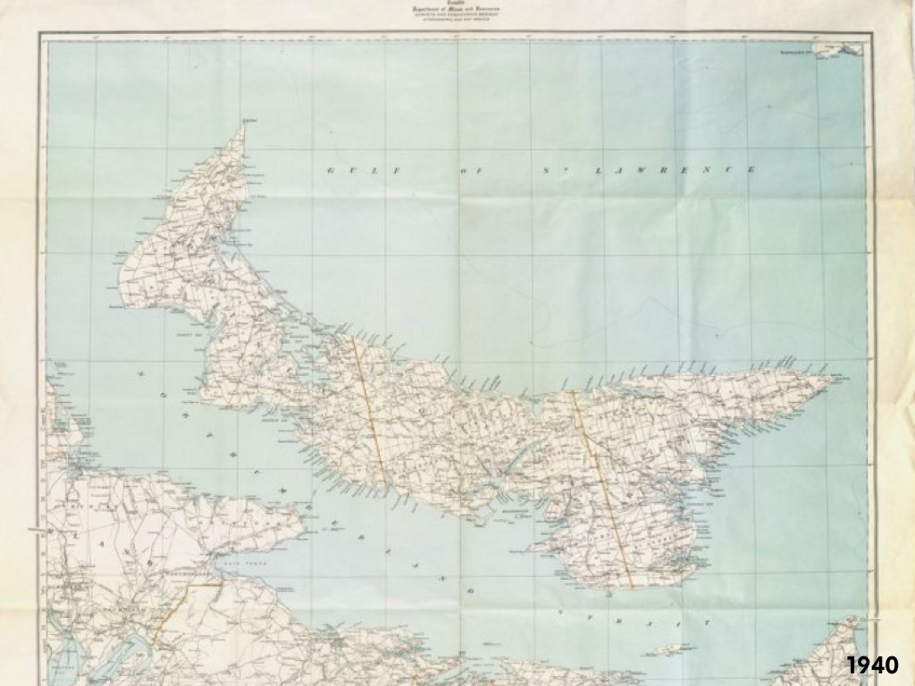
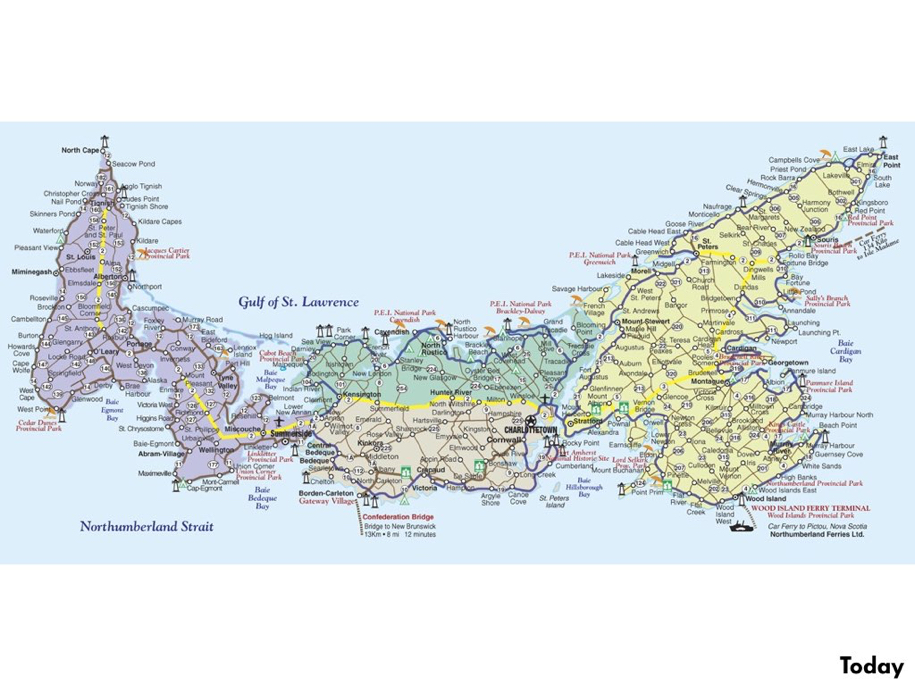
I then led the students through a visual history of maps of Prince Edward Island – helpfully mined from IslandImagined.ca – from 1666 to the current day:
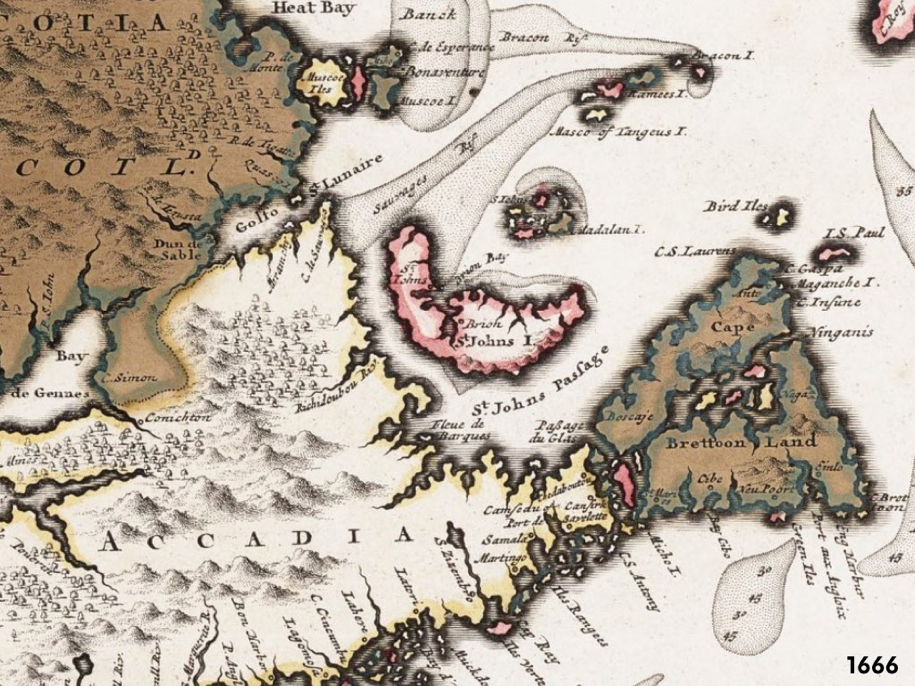
PEI Map, 1666

PEI Map 1687

PEI Map 1690

PEI Map 1751

PEI Map 1765

PEI Map 1773

PEI Map 1798

PEI Map 1860

PEI Map 1863

PEI Map 1940

PEI Map Today

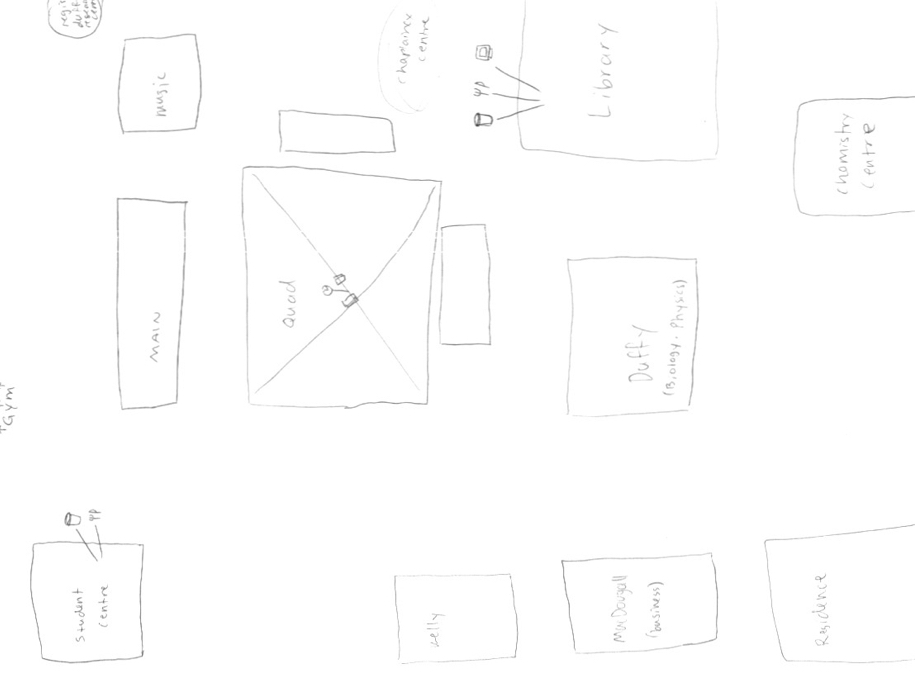
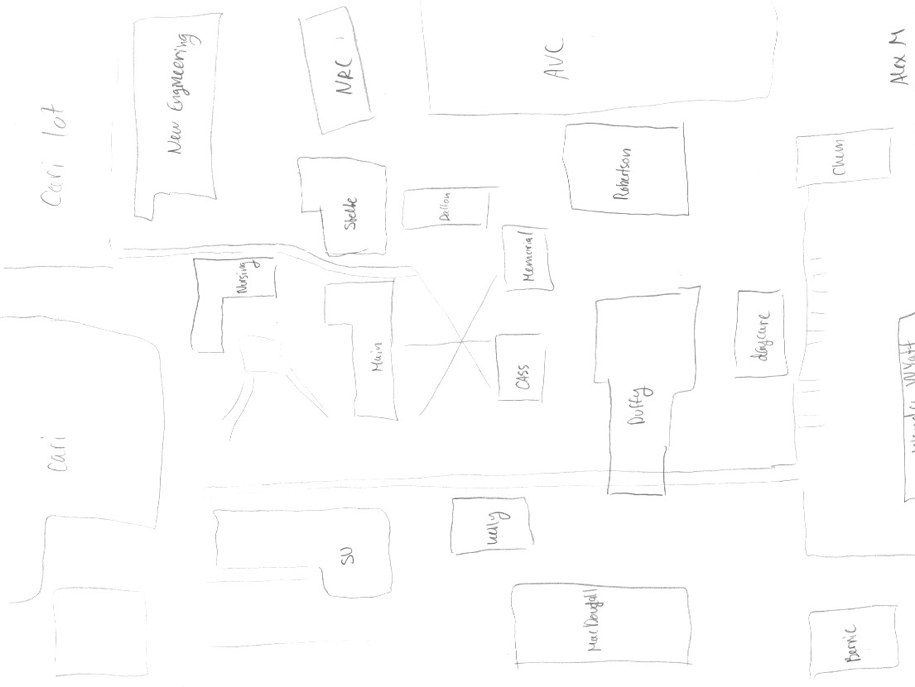
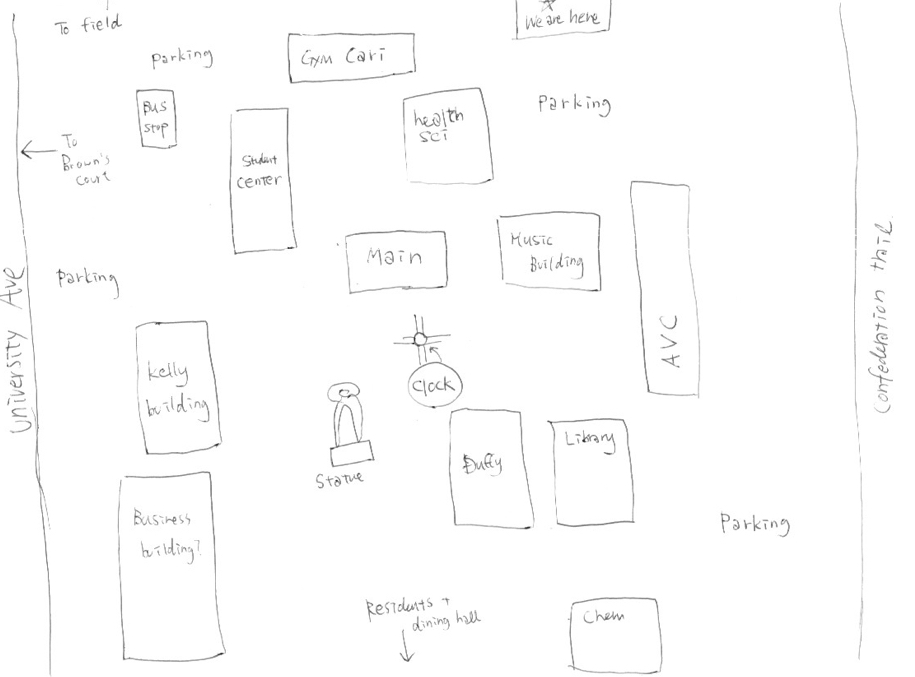
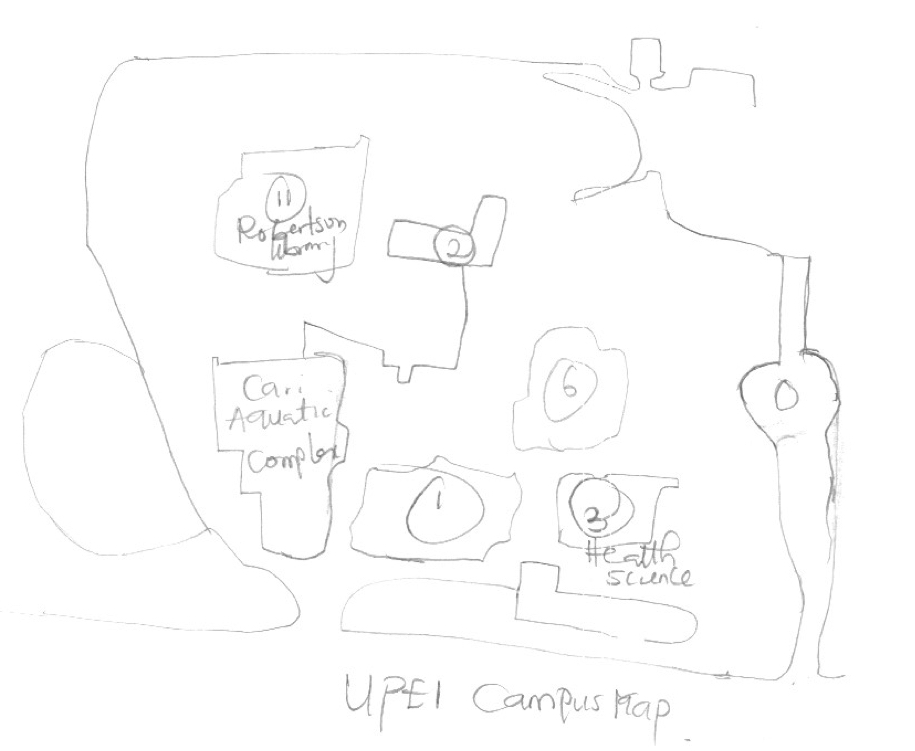
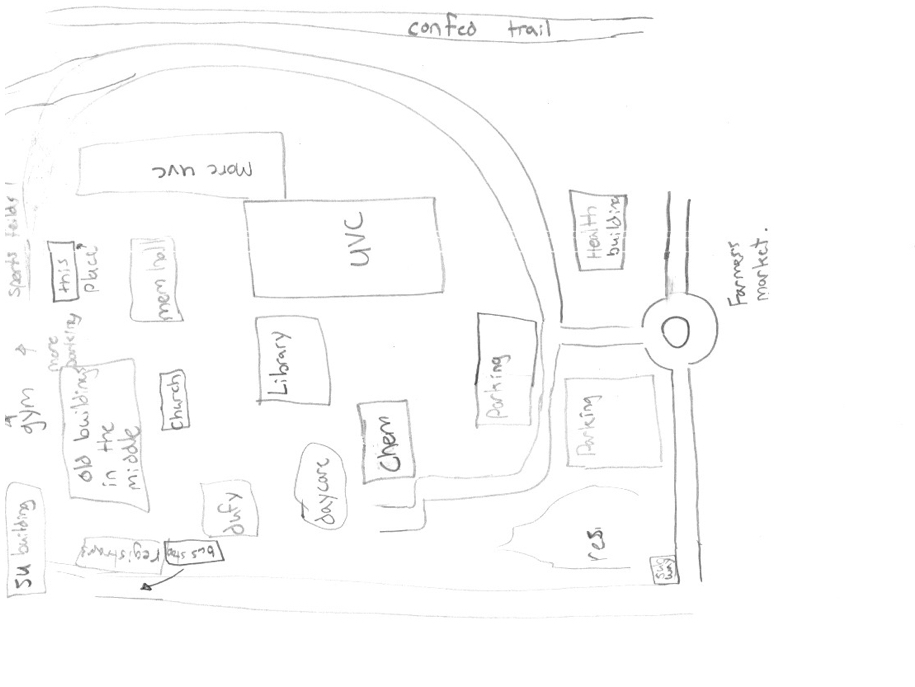
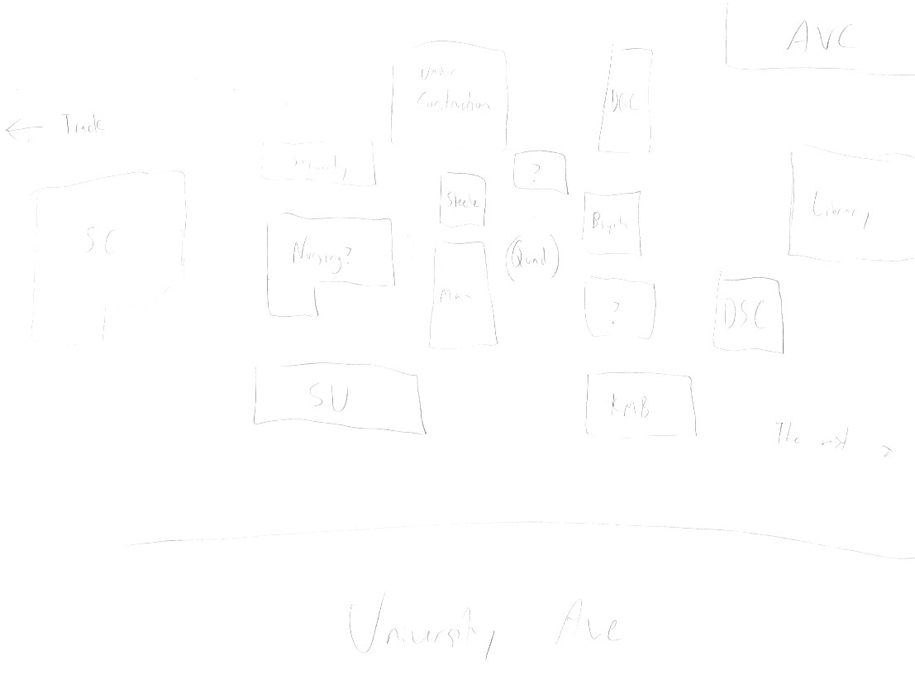
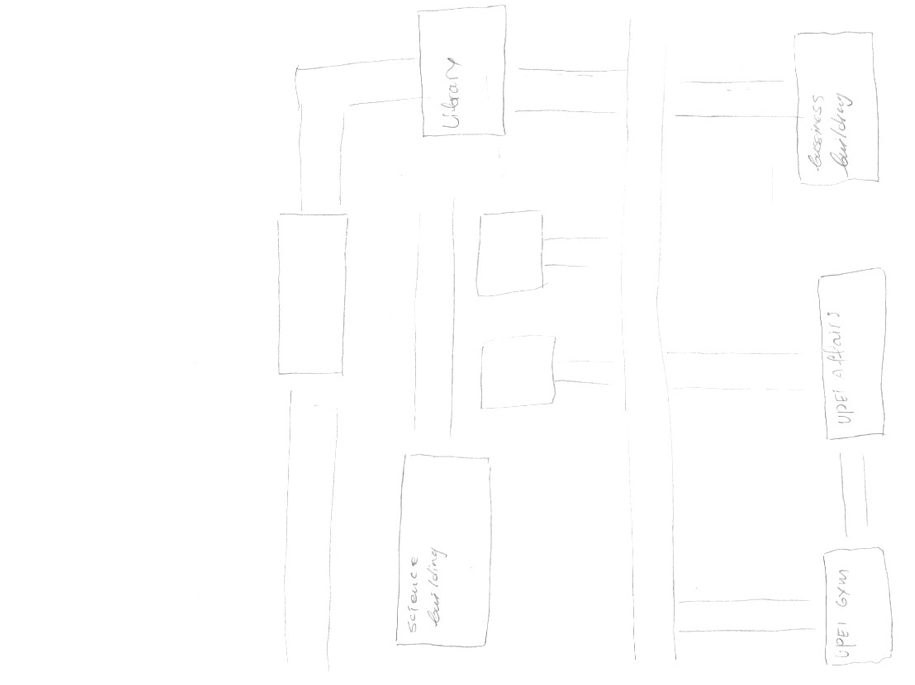
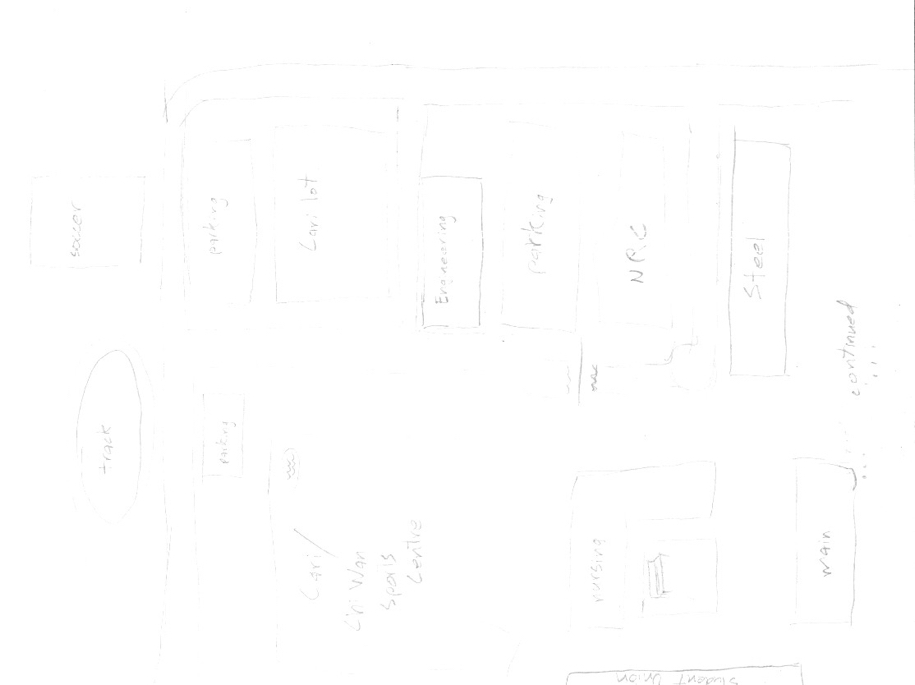
I wanted to reinforce that maps exist in a cultural context and a technology context: evolutions in our ability to measure, to communicate and to print all influence the maps we can produce, and the maps we can produce influence our mental model of where we live. In this spirit, I then presented the students with a quick challenge: take 5 minutes, a sheet of card stock and a pencil, and make a map of the University of PEI campus, suitable for handing to a new student who needs to get their bearings.
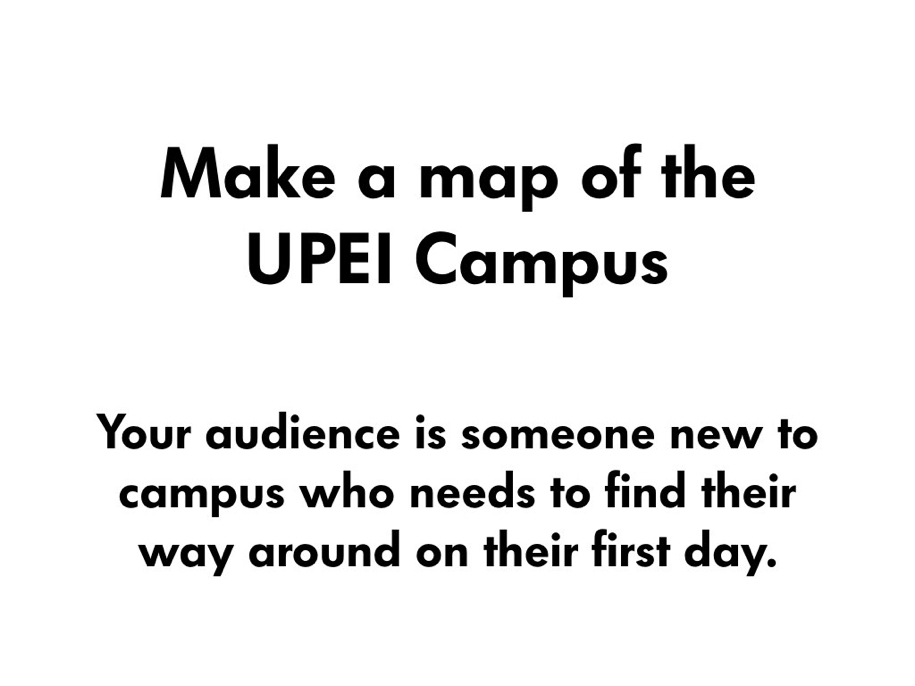
Make a Map!

The results of this exercise – I gave them about 10 minutes to finish – were very interesting: 10 students prepared 10 very different maps, with different levels of detail, perspectives, orientations, levels of accuracy, style. I posted all of the maps on the whiteboard at the front of the classroom and asked them all to come up and take a look at them, and to compare and contrast their own maps to others. I didn’t need to say any more: the results proved the point that maps have politics, maps have limitations, maps represent the world view of the creator and the tools available to them.
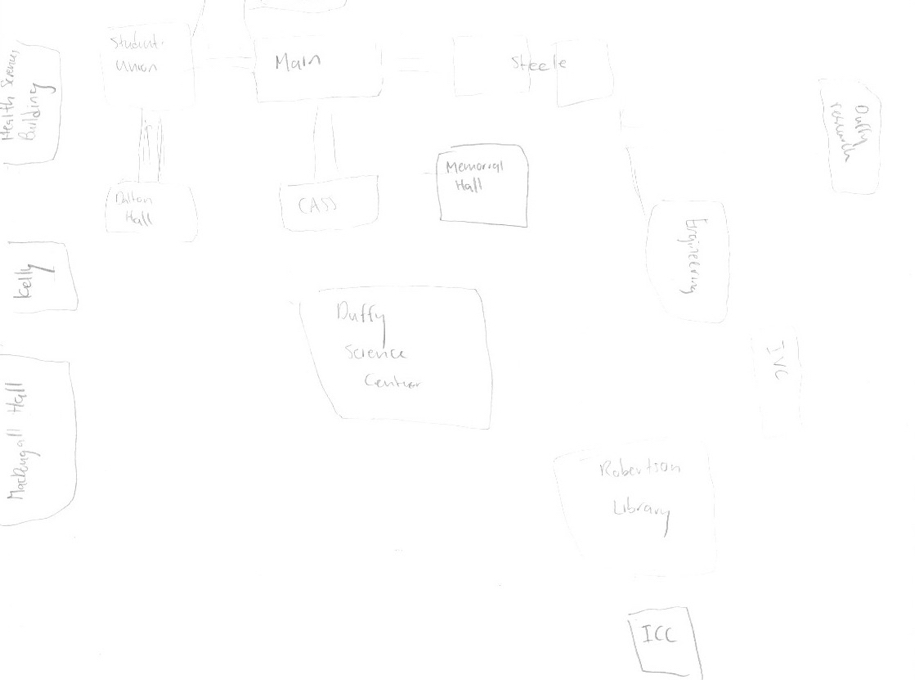
Campus Map 1

Campus Map 2

Campus Map 3

Campus Map 4

Campus Map 5

Campus Map 6

Campus Map 7

Campus Map 8

Campus Map 9

Campus Map 10

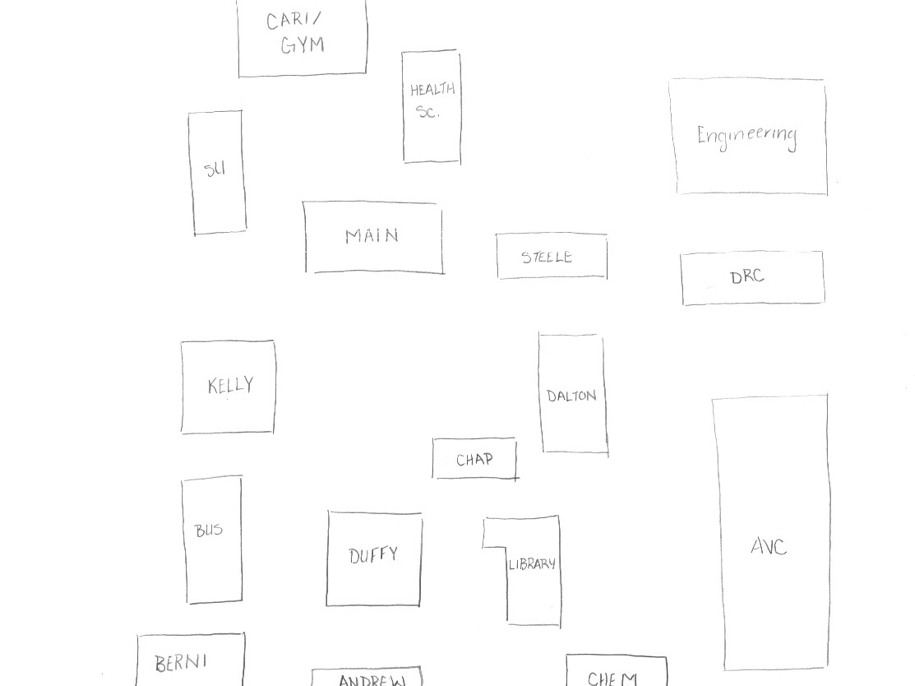
I threw my own version of the map into the ring for comparison (I created it at the same time as the students were creating theirs, and that in itself was a learning experience for me):
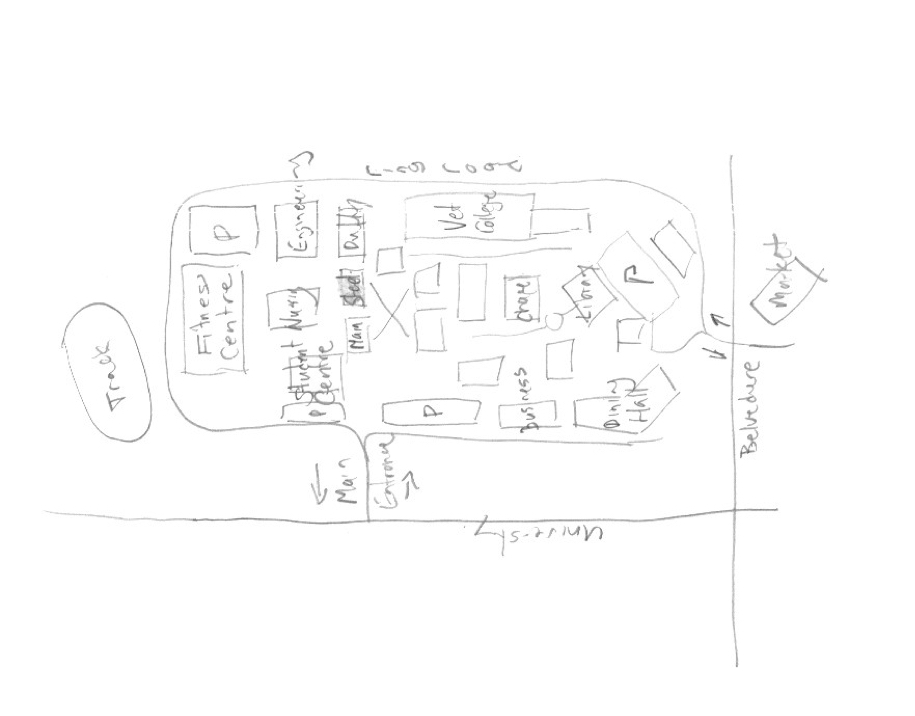
My Campus Map

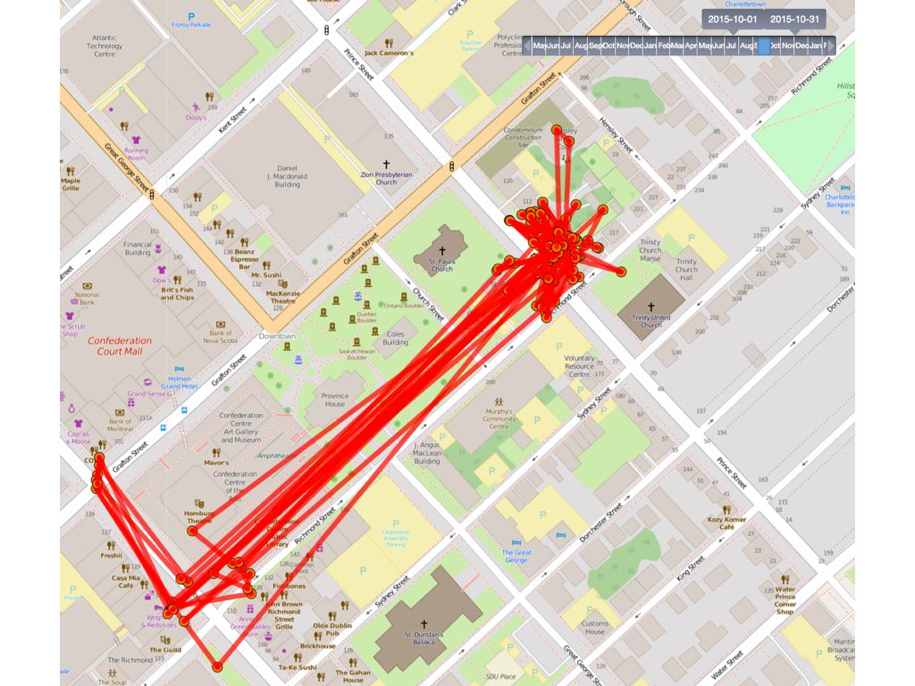
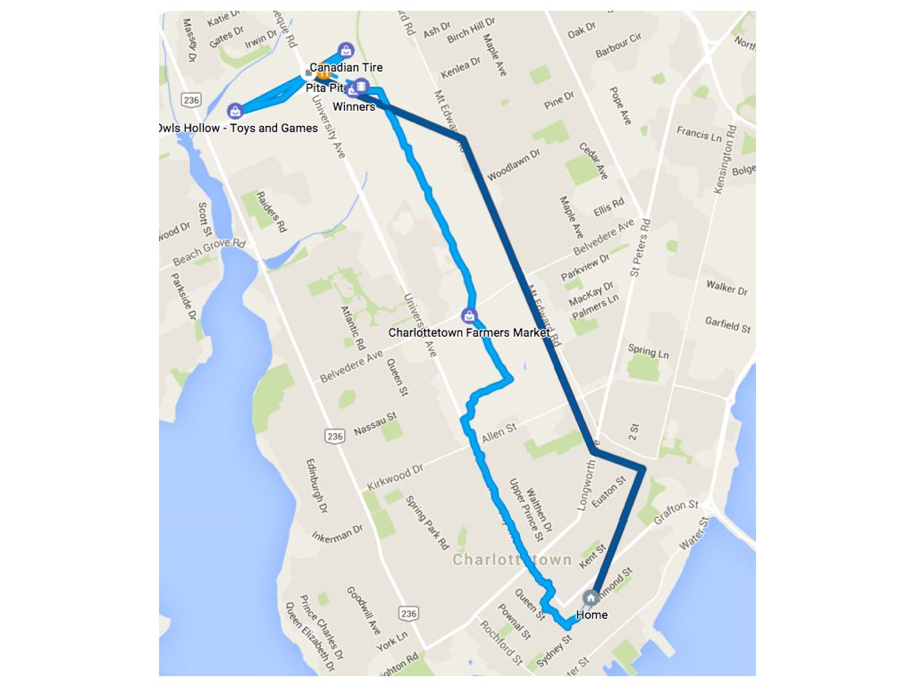
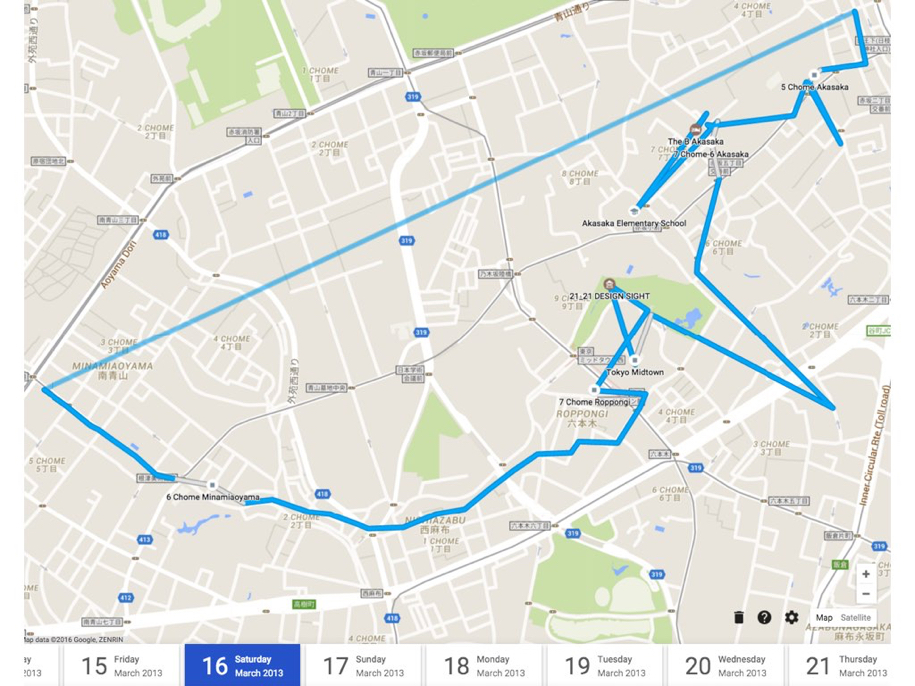
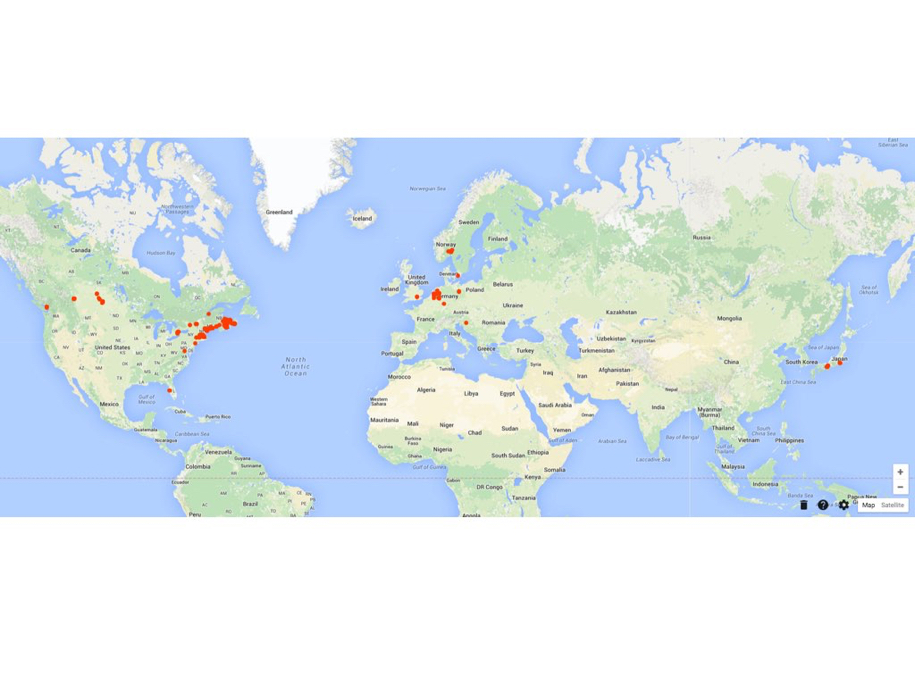
With the scene set, I then walked the students through a series of slides that illustrated how I leave a “digital breadcrumb” wherever I go, and how the collection of those breadcrumbs together tells a set of stories, and leaves a digital fingerprint of my passing:
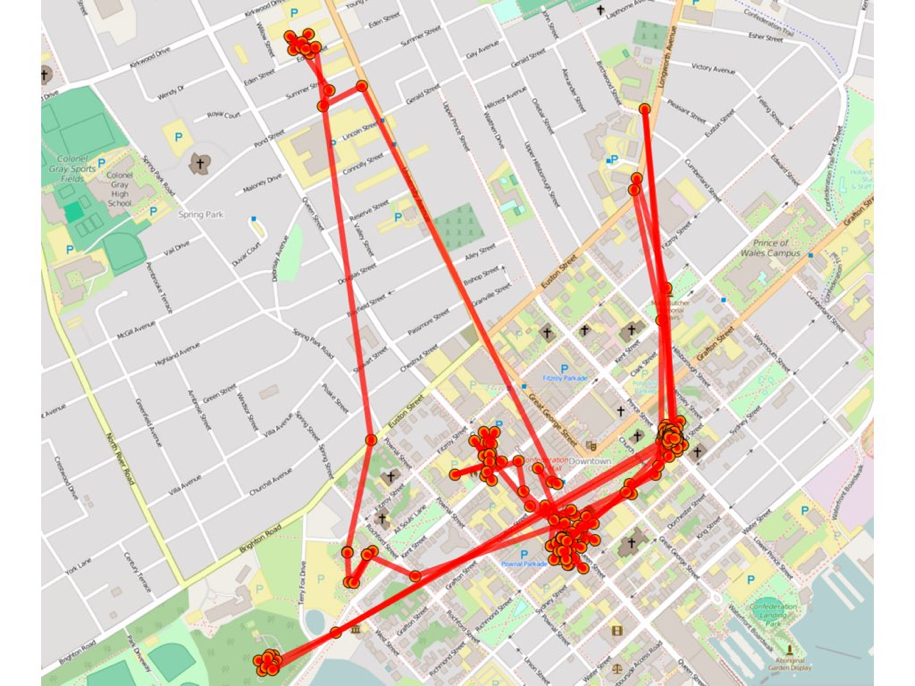
My DIgital Breadcrumbs

My Breadcrumbs Number Two

I then showed how the same data, from the same phone, also shared with Google, and thus merged with what Google knows about the world, can result in more meaningful (but also, possibly, more creepy) maps, like this map of my walk to Birchwood with Oliver this morning:
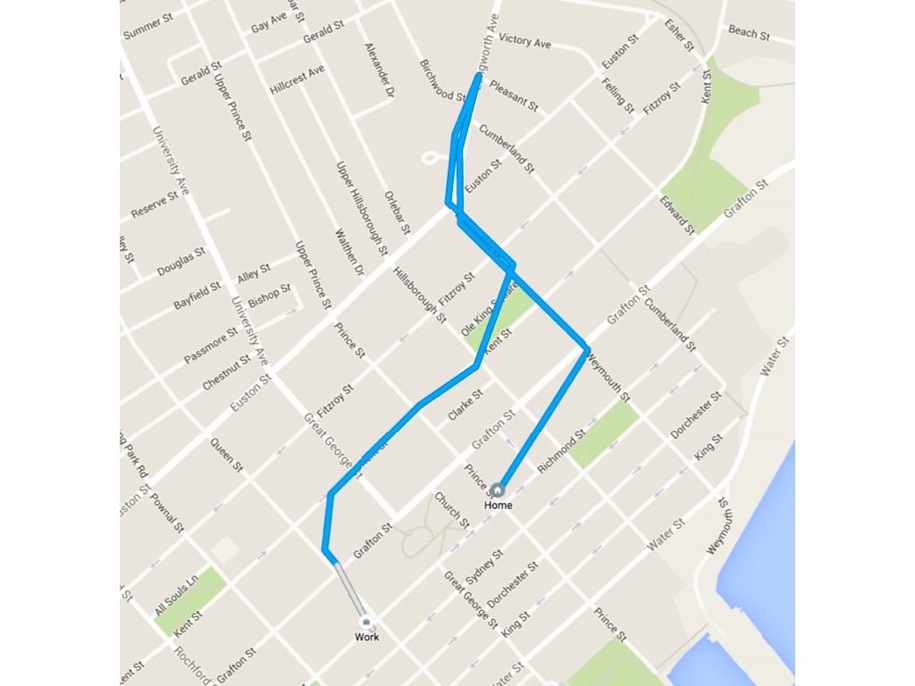
Google Locaiton History

Another Google Map

Japan Map

My Google Location History

With the notion of “meaningful breadcrumbs” established, I then asked the students if they could identify this:
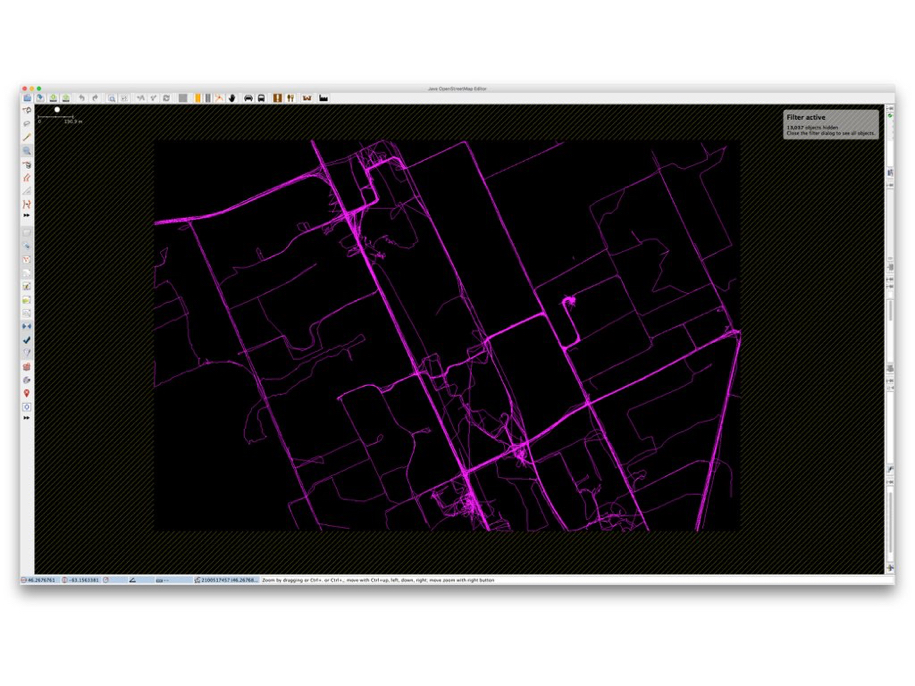
Geotraces from OpenStreetMap of UPEI

When they couldn’t guess, I added a hint:
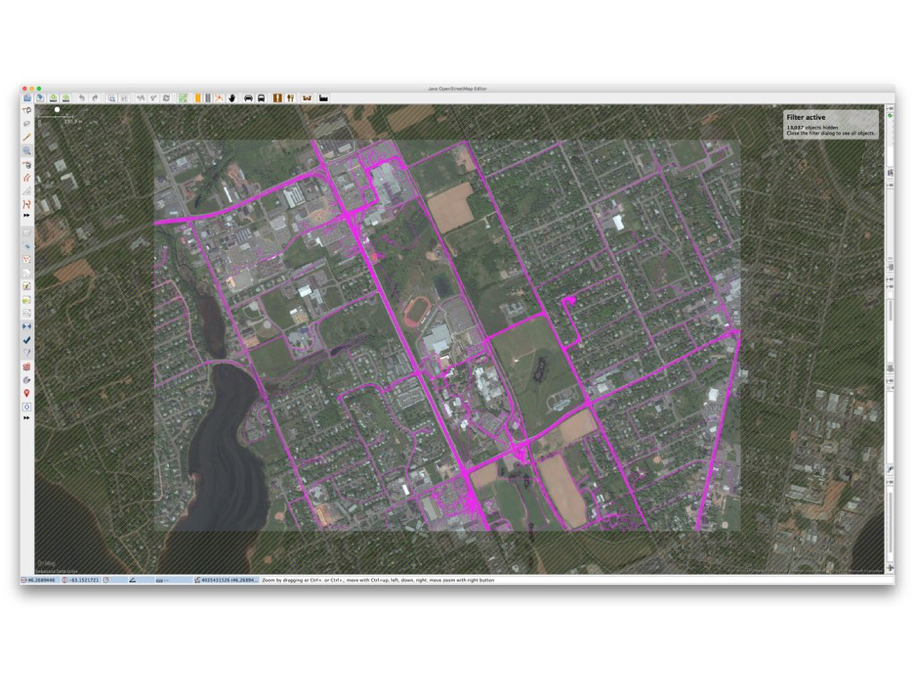
OpenStreetMap Geotraces + Bing Satellite

The running track was the clue that was needed to identify the location as the University of PEI itself, and I explain that the purple traces were the collected GPS traces of OpenStreetMap contributors, traces that, in enough volume like this, carve a sort of de facto map of the city.

Next, to introduce OpenStreetMap, I showed an introduction to the project by its founder Steve Coast:

By way of introducing the underlying technical philosophy of OpenStreetMap, I discussed how, at its core, it’s about points, lines and areas, like this:
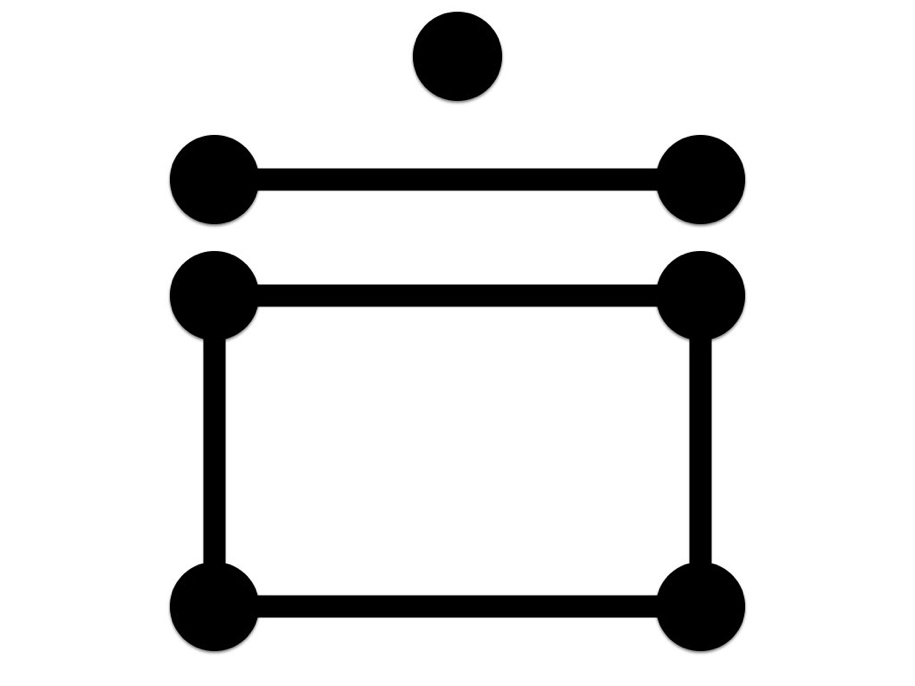
OSM Fundamentals: Points, Lines, Areas

Using those primitive elements, OpenStreetMap allows these GPS traces:
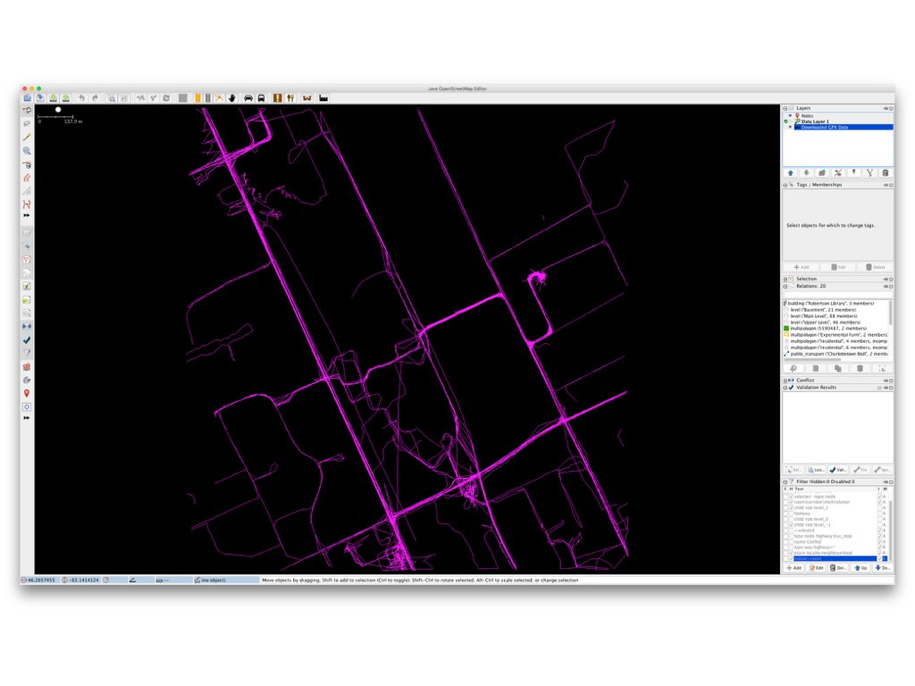
GPS Traces

combined with satellite maps with a license that allows for tracing:
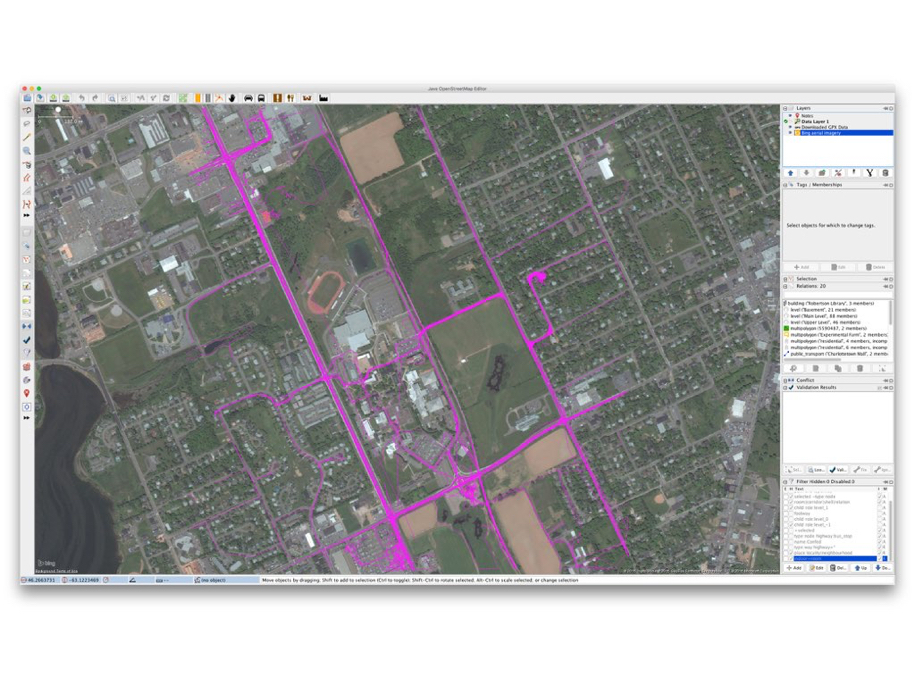
Traces and Bing Map

to be used to create features, and then to tag those features with metadata – this is a road, this is a path, this is a building, etc. – to create the raw materials for a map:
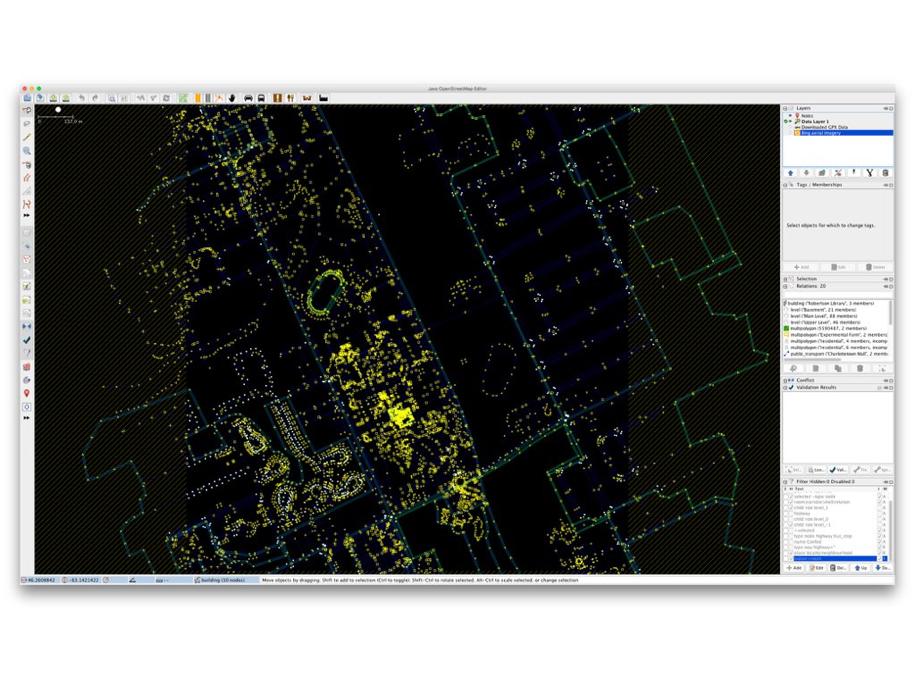
OpenStreetMap of UPEI in JOSM

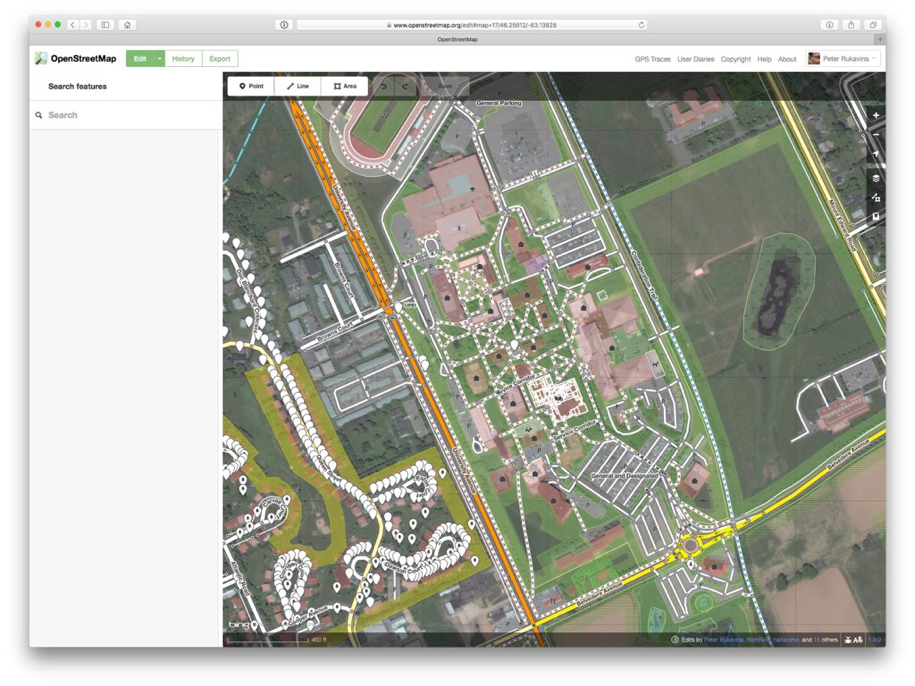
A map that, when a set of rendering rules are applied to it – make residential roads white, major roads orange, grass green, etc. – results in a human-readable map like this:
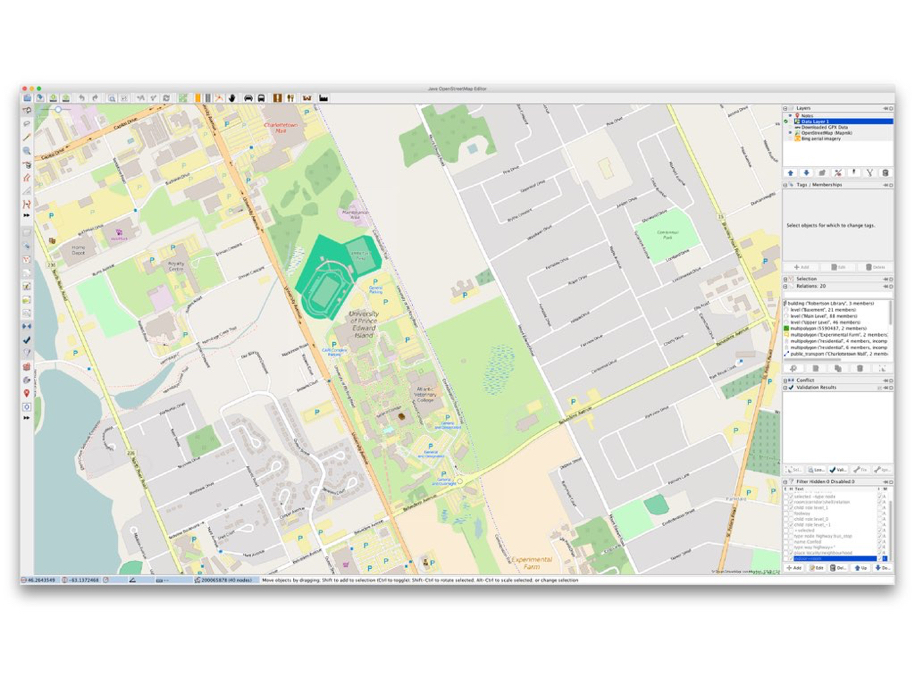
OpenStreetMap of the UPEI Campus

And that this is something that can be done not only with purpose-built standalone software, but in a web browser, by anyone, just by clicking “Edit”:
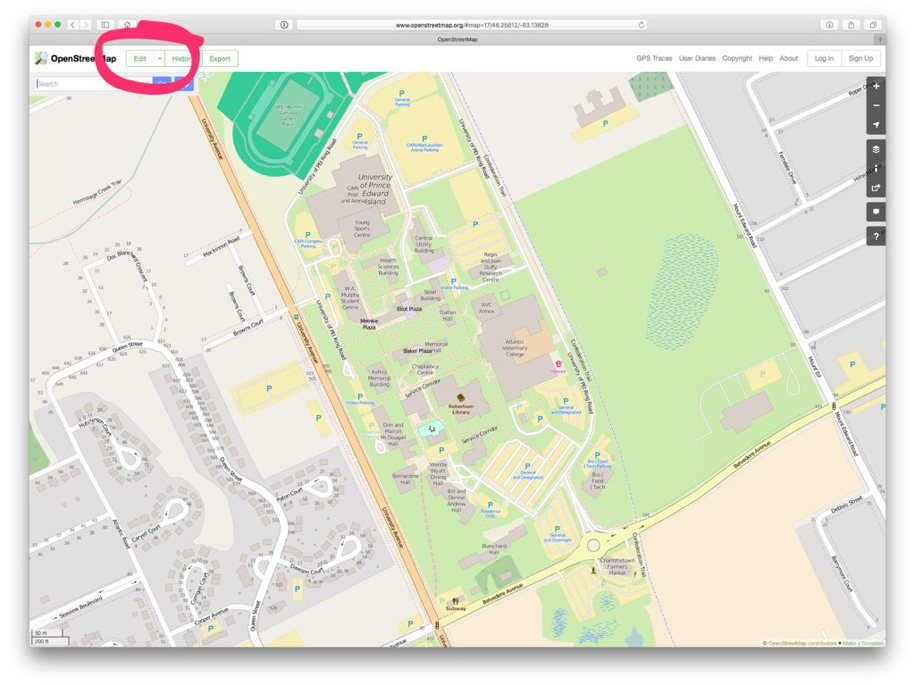
OpenStreetMap Edit Button

Editing OpenStreetMap

I demonstrated how the map itself a collaborative, open project, but also how the standards that drive them map – how to tag a coffee shop, how to identify a bicycle path – are developed collaboratively and in the open too, in the OpenStreetMap wiki:
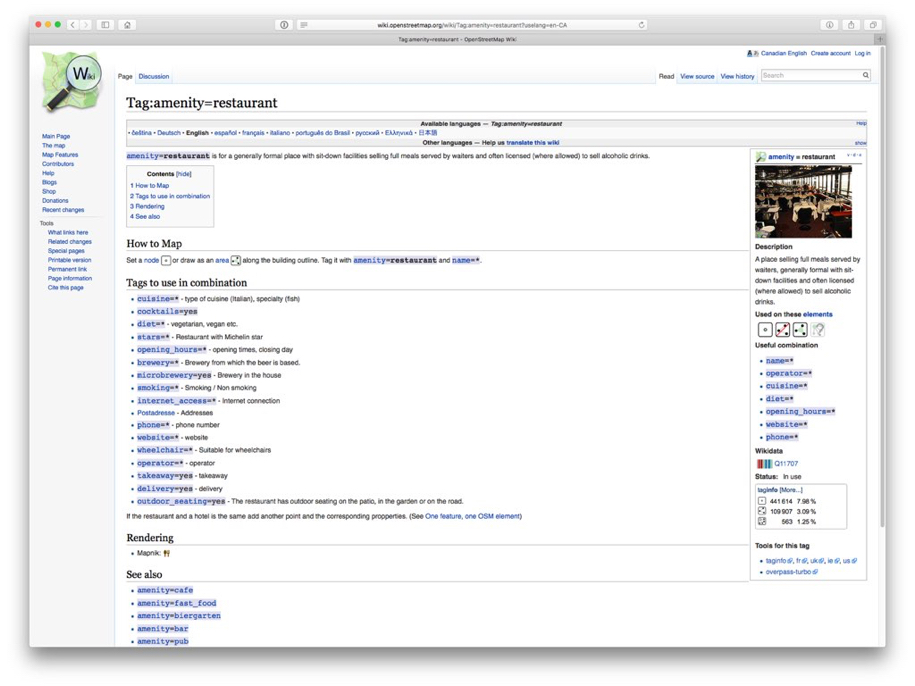
OpenStreetMap Wiki Page Example

With this basic understanding of the mechanics of OpenStreetMap in place, I showed the OpenStreetMap 10th Anniversary visualization video to give them a sense of the scale of the mapping community:

To illustrate that the project isn’t just about making slippy maps for the browser that all look the same, I showed them some examples of different manifestations of OpenStreetMap data, like walking directions:
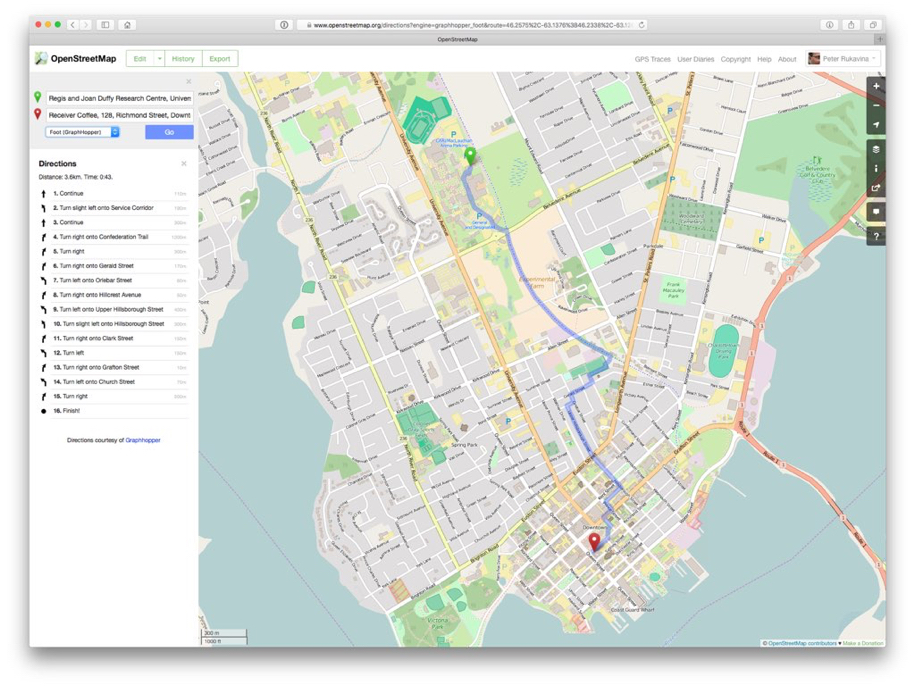
OpenStreetMap Walking Directions

And commercial use of the map data by Foursquare:
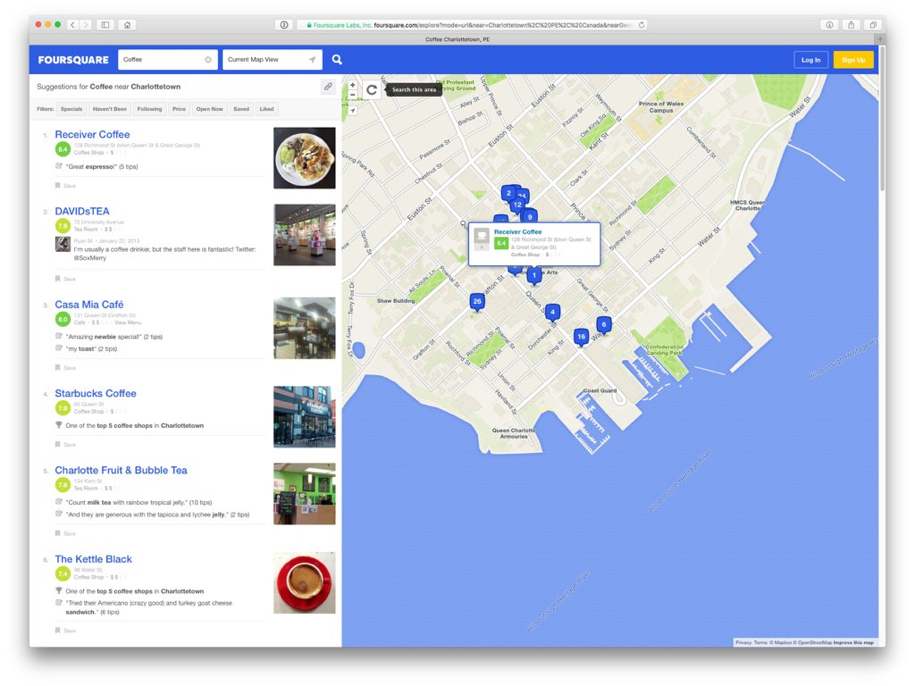
Foursquare Maps

Baby Onesie’s imprinted with the map area of your choice:
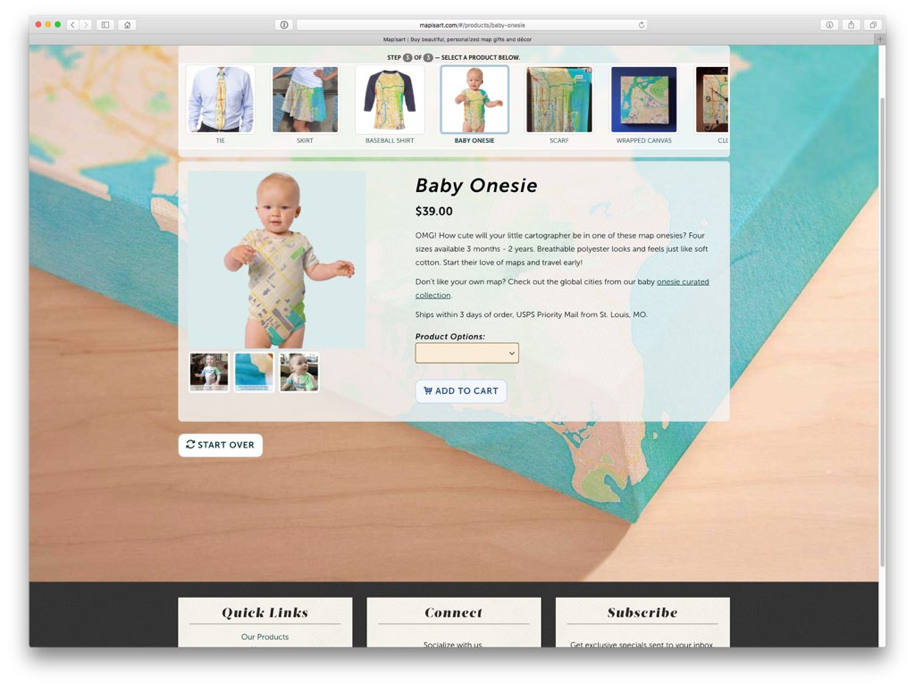
OpenStreetMap on a Baby Onesie

And the Humanitarian OpenStreetMap Team:

As a final exercise, with all of the above in mind, I asked them to return to the challenge of mapping the University of PEI campus, but this time as a collaborative project, using the whiteboard and the markers I’d given them at the start of the first lecture a week ago:
Make a Map Together!

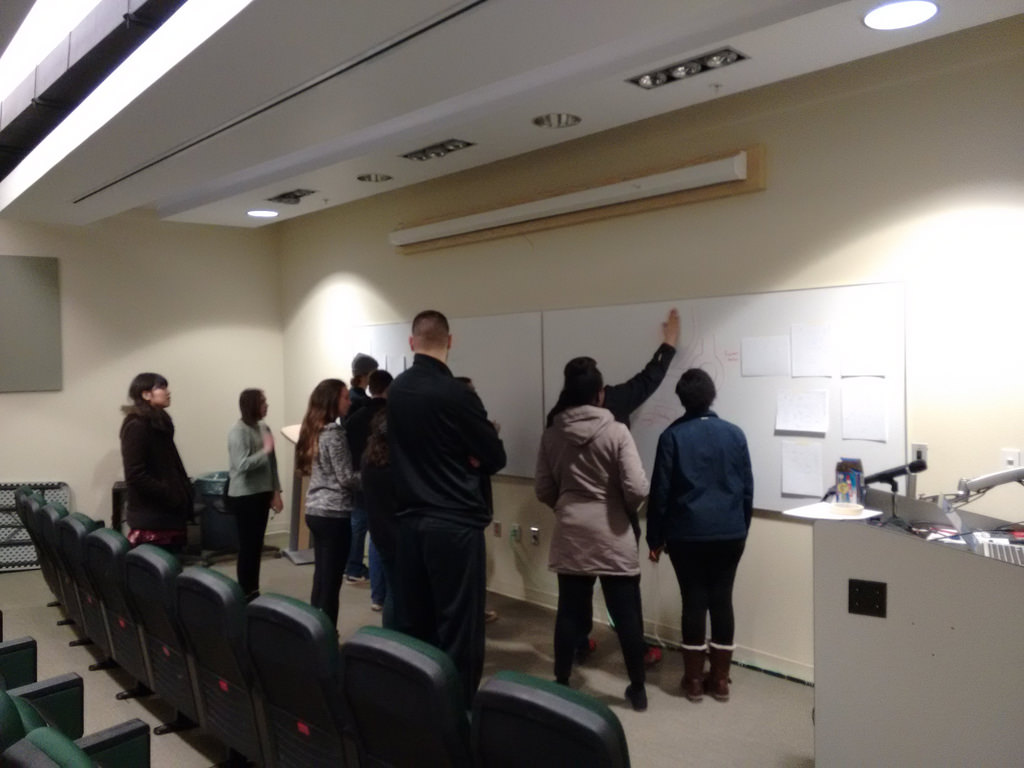
They gamely rose to this challenge:

Philosophy 105 Students Mapping the Campus

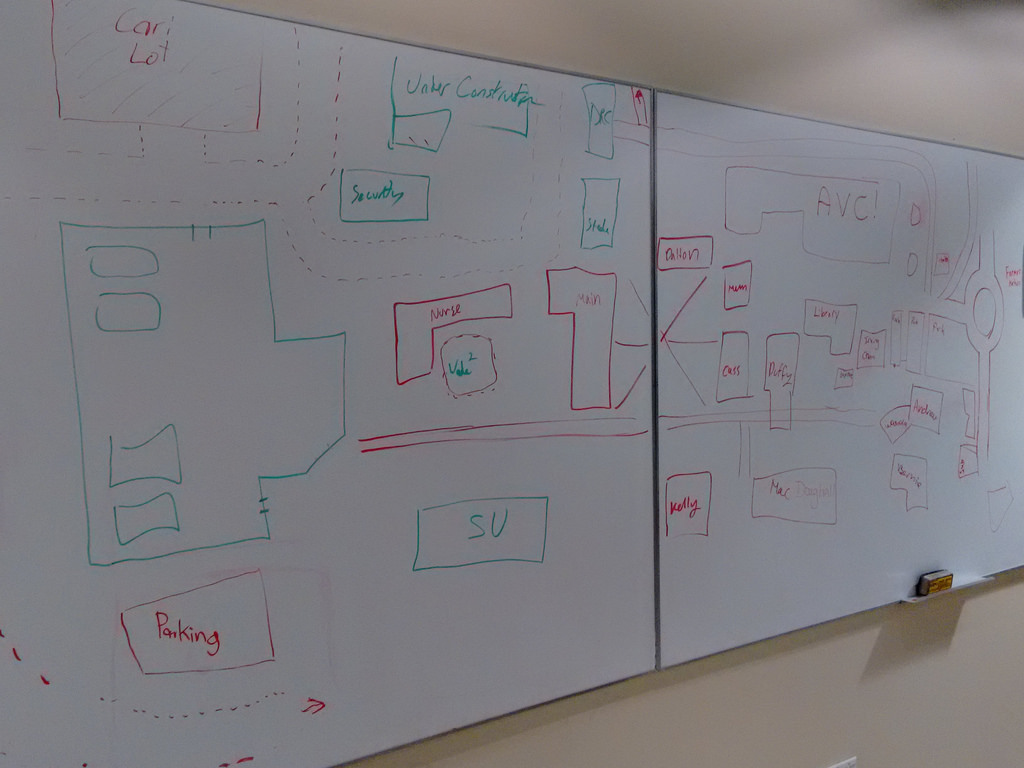
Some students held back – it was a cramped area to work together in, especially for students not used to doing so – but two groups emerged naturally that worked together on opposite ends of the campus. They achieved a surprising amount of detail and accuracy for a 10 minute whiteboard exercise:
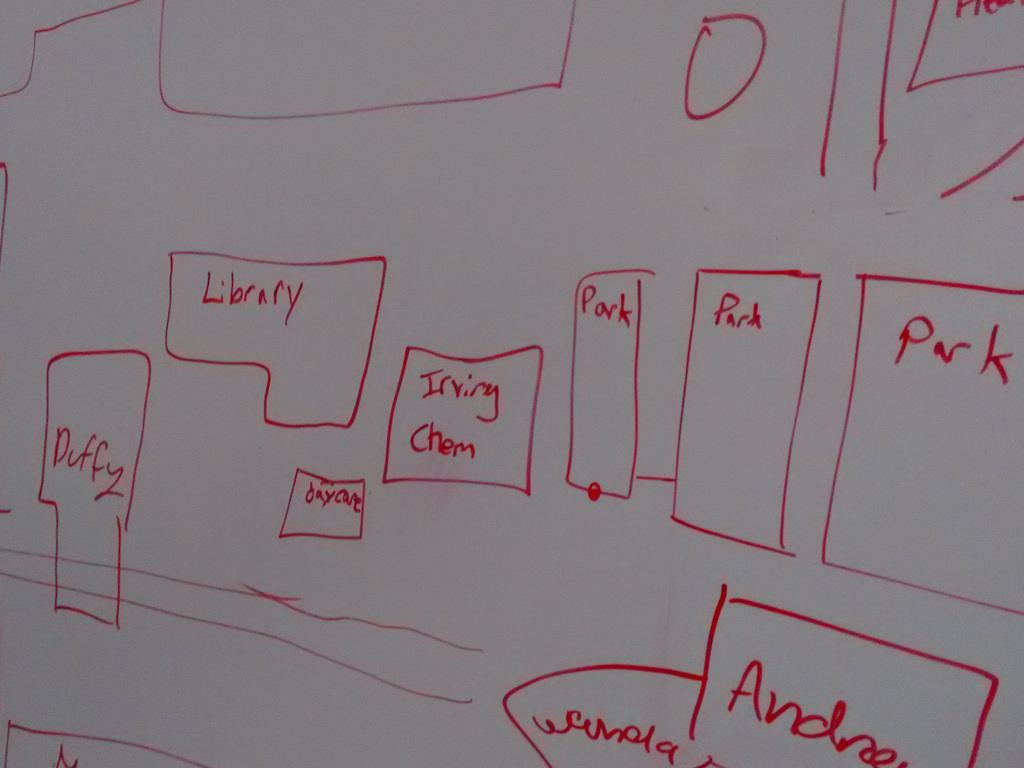
UPEI Campus Map

UPEI Campus Map

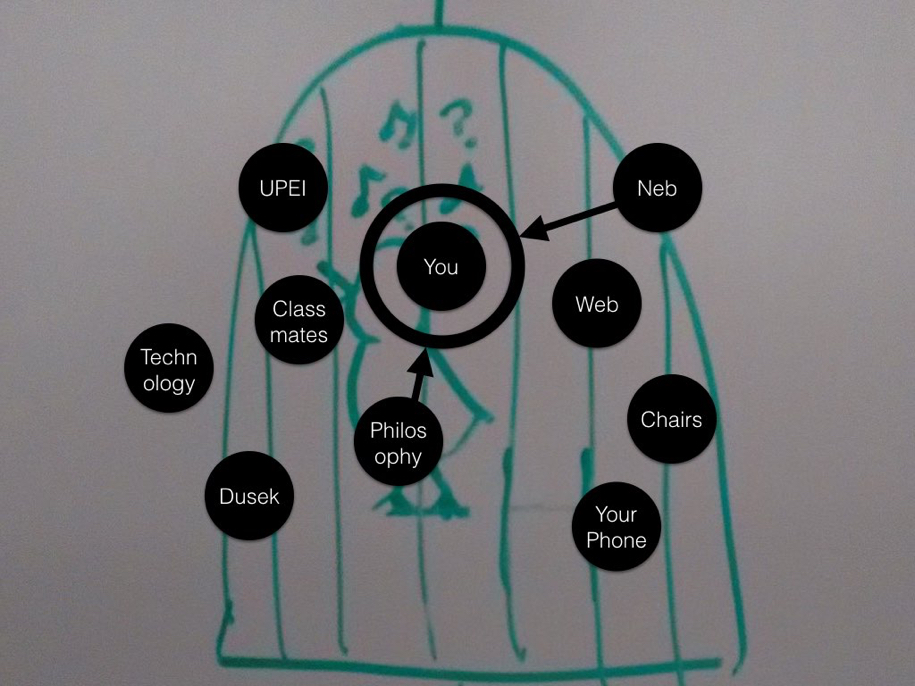
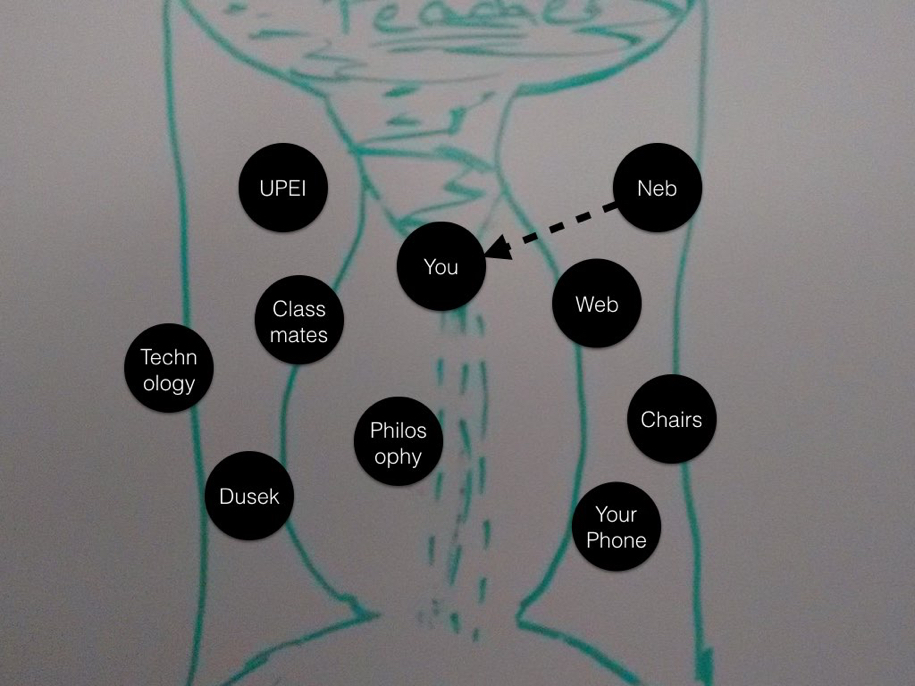
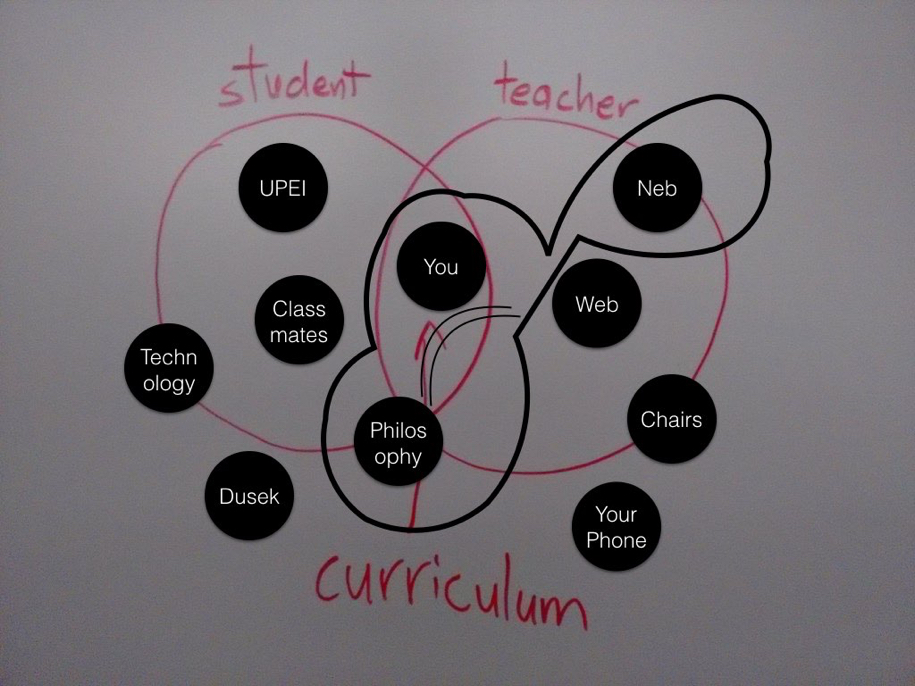
As a final effort to knit four lectures and a lot of seemingly disconnected material together, I talked about how what united the notions of “university as a technology,” open data and open mapping was the idea of agency: agency as an actor in their education, agency over developing shared conceptions of the physical world through maps, agency over the data about them and from them that is used to shape policy.

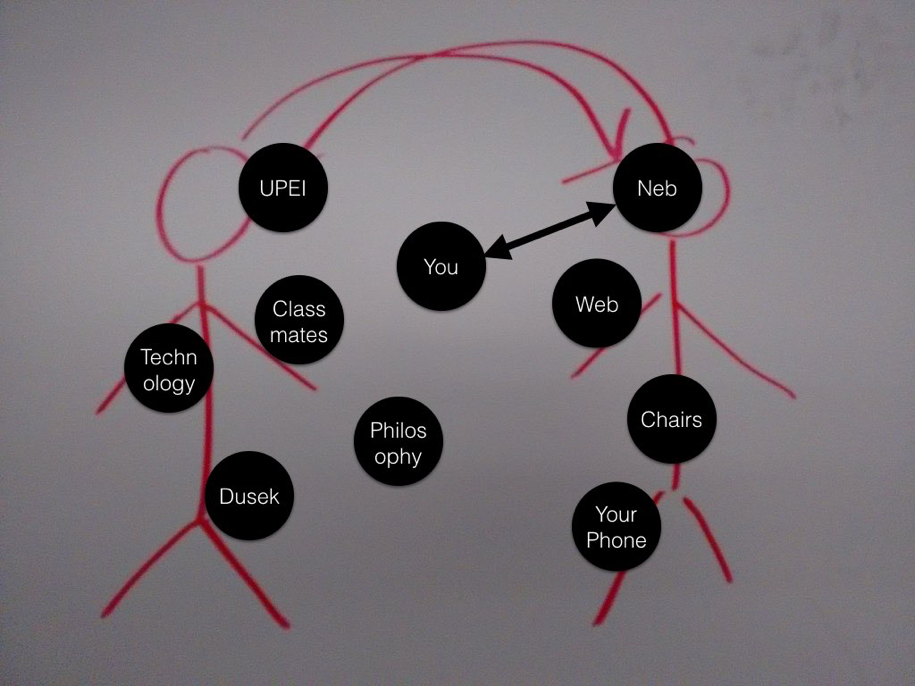
I referred back to the visualization of their own university education to date that I’d asked them to prepare in my first lecture by way of talking about different models – different conceptions of agency – in their education:
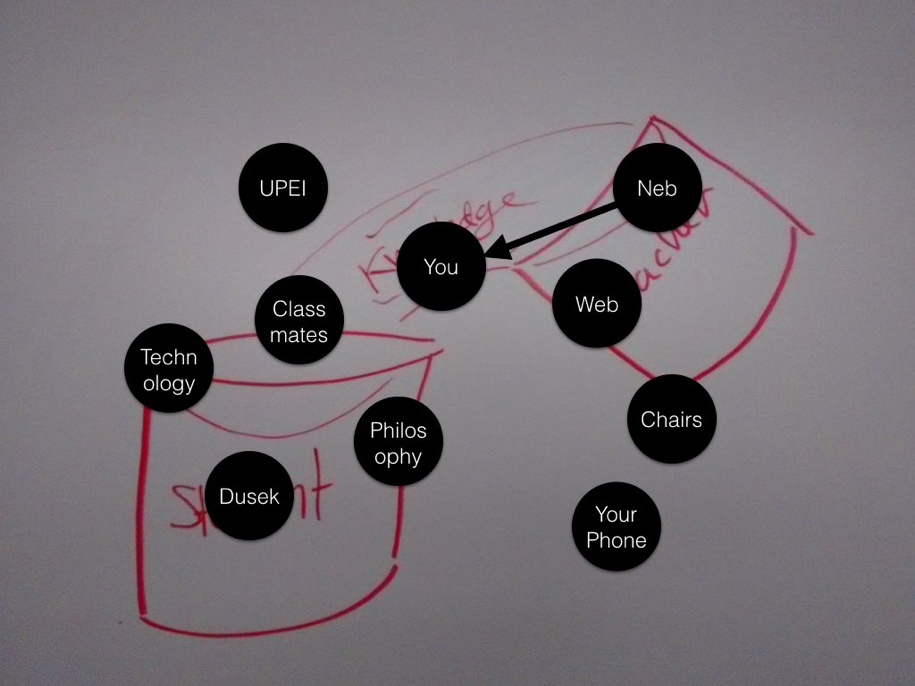
Agency 1

Agency 2

Agency 4

Agency 5

Agency 3

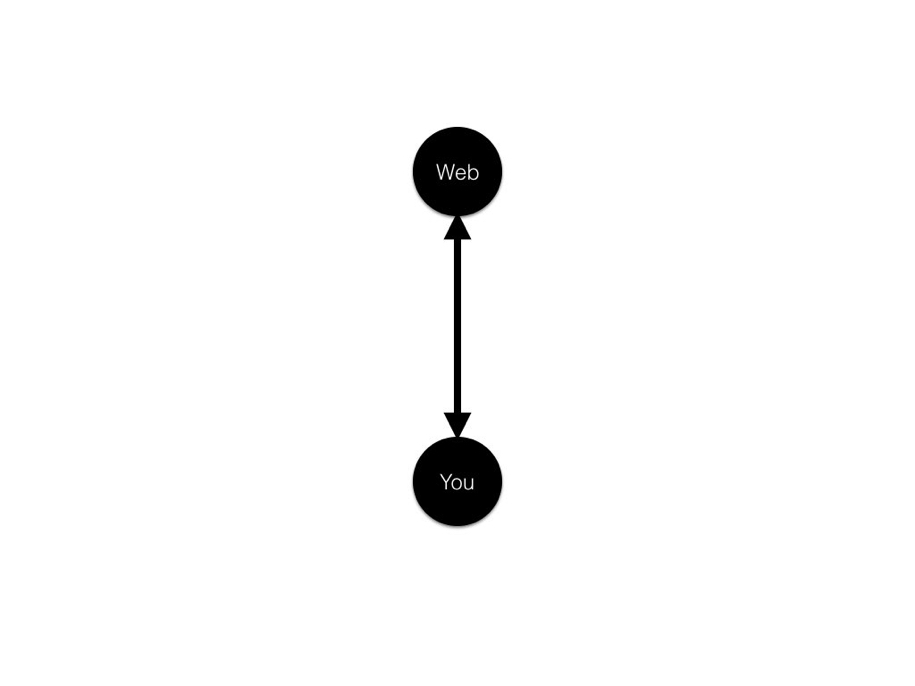
I illustrated several models of the relationship of the individual actor to the web. As a consumer:
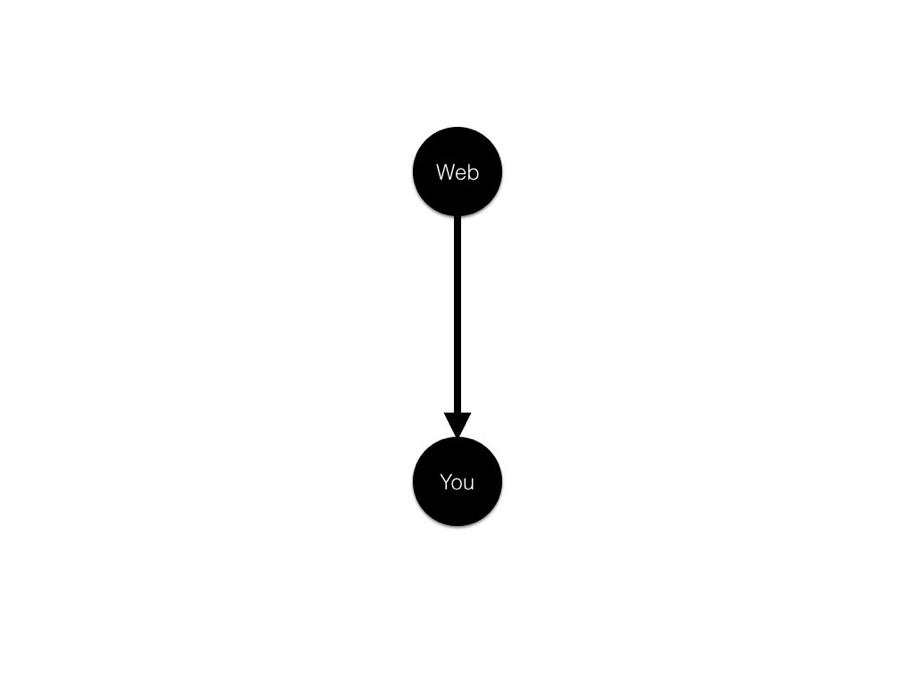
Consumer of the Web

Consumer of and contributor:

Consumer and Producer

And, perhaps most accurately, consumer of, contributor to, collaborator around, conduit through, as actor in a complex system that they are affecting and that is affecting them:
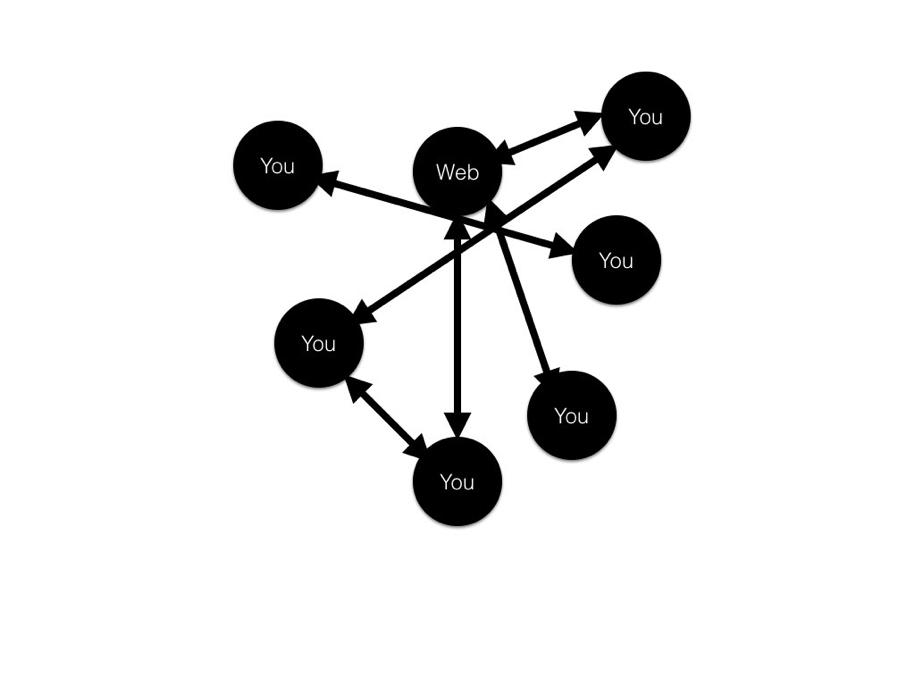
Complex Web

And with that, we were done. 

I asked the students if they had any feedback on our time together, and they said I was welcome back, which was about as high a compliment as I can imagine. I asked them for a class picture, and they generously obliged:
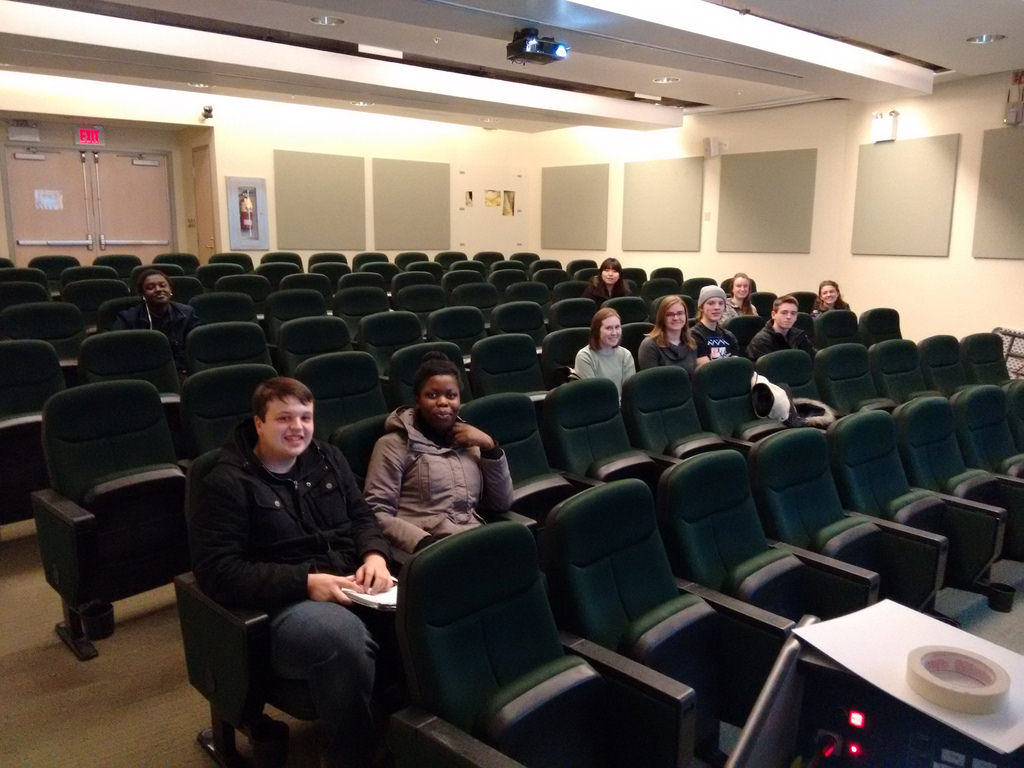
IMG_20160302_143631

I’ll likely have more to write about this experience in a university classroom once I’ve had a chance to ruminate on it for a while. I do come away with both a renewed appreciate for the challenges of the teaching profession but also an awareness that, when a plan comes together and learning is oozing out of the room, there is no better high.

🗓️

About This Blog

Photo of Peter RukavinaI am . I am a writer, letterpress printer, and a curious person.

To learn more about me, read my /now, look at my bio, listen to audio I’ve posted, read presentations and speeches I’ve written, see things I’ve favourited elsewhere, or get in touch (peter@rukavina.net is the quickest way).

I have been writing here since May 1999: you can explore the 25+ years of blog posts in the archive.

You can subscribe to an RSS feed of posts, an RSS feed of comments, an RSS feed of favourites elsewhere, or a podcast RSS feed that just contains audio posts. You can also receive a daily digests of posts by email. I also publish an OPML blogroll.

Instagram • YouTube • Vimeo • ORCID • OpenStreetMap • Internet Archive • PEI.art • Drupal • Github.