
Google Maps for Android has a feature that has been alternatively referred to as “Latitude” “Location History” and “Timeline” that allows me to drop a constant stream of digital breadcrumbs marking my location and to then explore that on a map.
I’ve been dropping these breadcrumbs, off and on, for 8 years, so I have a lot of data accumulated: 1.3 million breadcrumbs in total, from January 15, 2010 until today.
Visiting Google’s “Your Timeline” page in a desktop browser allows for some basic visualization and analytics for this data; here’s what my vagabonding looks like:
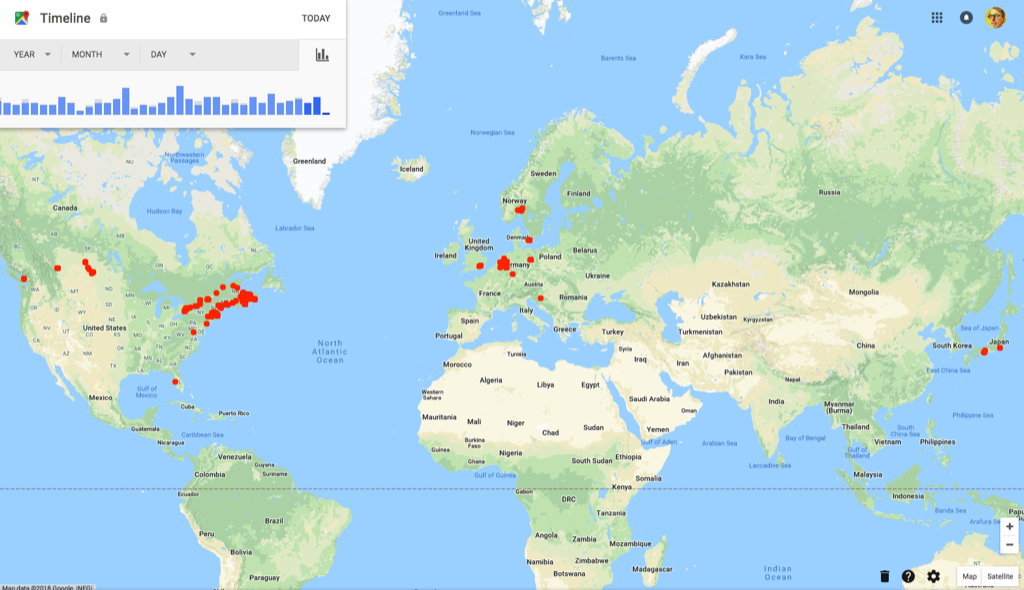
This is an incomplete picture of my travels because I haven’t always had an Google Maps-capable phone in my pocket and, even when I have, I haven’t always had a data plan that would allow me to gather the data. This is why you don’t see any markers in Ukraine, for example: I was carrying an old Nokia N95 on my trip there in 2012.
Google Maps also attempts to auto-correlate my travels to points of interest where I’ve stopped along the way. It’s recorded 887 of these over the years, and the same high-level overview reports on the top 10 places I’ve visited:
- 100 Prince Street (my house)
- The Guild (my office for 7 years)
- Charlottetown Farmer’s Market
- Colonel Gray Senior High School
- Mad Wok
- Sobeys
- Receiver Coffee
- Casa Mia Café
- Birchwood Intermediate School
- Queen Elizabeth Hospital
That’s my life pretty well in a nutshell.
Google’s “takeout” service allows me to export all 1.3 million geolocations into a JSON file that I can then use outside of Google Maps. And, indeed, there’s more than just geolocations in the file, as Google Maps is not only tracking nodes on the graph of my life, but edges too. For example, here’s a slice of my Friday:
{
  "locations" : [ {
    "timestampMs" : "1527896063946",
    "latitudeE7" : 462356055,
    "longitudeE7" : -631246024,
    "accuracy" : 16,
    "altitude" : -15,
    "verticalAccuracy" : 2
  }, {
    "timestampMs" : "1527896058549",
    "latitudeE7" : 462357912,
    "longitudeE7" : -631240912,
    "accuracy" : 17,
    "altitude" : -17,
    "verticalAccuracy" : 3
  }, {
    "timestampMs" : "1527895978334",
    "latitudeE7" : 462357912,
    "longitudeE7" : -631240912,
    "accuracy" : 17,
    "altitude" : -17,
    "verticalAccuracy" : 3
  }, {
    "timestampMs" : "1527895916802",
    "latitudeE7" : 462357912,
    "longitudeE7" : -631240912,
    "accuracy" : 17,
    "altitude" : -17,
    "verticalAccuracy" : 3,
    "activity" : [ {
      "timestampMs" : "1527895917135",
      "activity" : [ {
        "type" : "STILL",
        "confidence" : 100
      } ]
    } ]
  }
}
The timestamps are in milliseconds, can can be converted into human readable dates with converters like this one, which tells me that that timestamps in this slice are:
- Fri Jun 01 2018 20:34:23
- Fri Jun 01 2018 20:34:18
- Fri Jun 01 2018 20:32:58
- Fri Jun 01 2018 20:31:56
From these timestamps, Google deduced that I was “STILL” during this period. Which, indeed, I was, as I was sitting here at my office desk typing away.
Other data points are more exciting, like this one from Friday afternoon:
{
	"timestampMs": "1527874663966",
	"latitudeE7": 462356055,
	"longitudeE7": -631246024,
	"accuracy": 16,
	"altitude": -15,
	"verticalAccuracy": 2,
	"activity": [{
			"timestampMs": "1527874645435",
			"activity": [{
				"type": "TILTING",
				"confidence": 100
			}]
		},
		{
			"timestampMs": "1527874659795",
			"activity": [{
				"type": "ON_FOOT",
				"confidence": 31
			}, {
				"type": "UNKNOWN",
				"confidence": 31
			}, {
				"type": "WALKING",
				"confidence": 31
			}, {
				"type": "IN_VEHICLE",
				"confidence": 8
			}, {
				"type": "ON_BICYCLE",
				"confidence": 8
			}, {
				"type": "STILL",
				"confidence": 8
			}, {
				"type": "RUNNING",
				"confidence": 8
			}, {
				"type": "IN_ROAD_VEHICLE",
				"confidence": 8
			}, {
				"type": "IN_RAIL_VEHICLE",
				"confidence": 8
			}, {
				"type": "UNKNOWN",
				"confidence": 4
			}, {
				"type": "UNKNOWN",
				"confidence": 4
			}]
		}
	]
}
This tells me that on Friday afternoon at 2:37 p.m., Google Maps deduces with 100% confidence that I was “TILTING” (I haven’t been able to find a definition for this, but it might mean my phone was in my hand, tilted) at location 46.2356055, -63.1246024, and that I was, with 31% confidence, engaged in a foot, walking, and/or unknown activity at the time. Looking at the Google Maps rendering of my Friday afternoon, it looks like this was the return to work from coffee with a friend at Leonhard’s and the removal from my bag of my phone to plug it in.
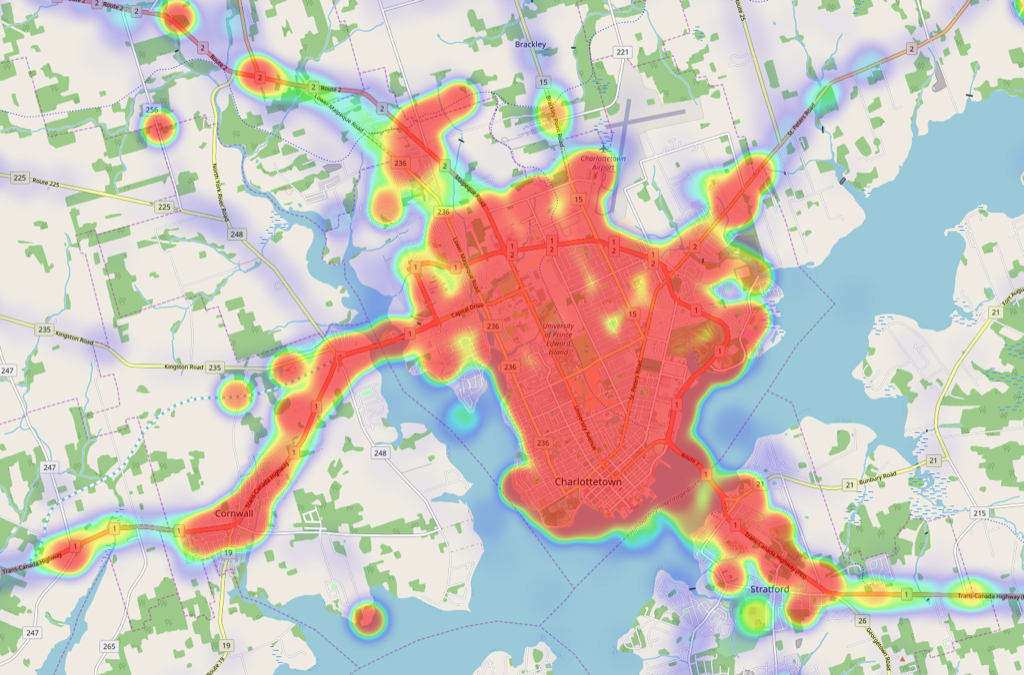
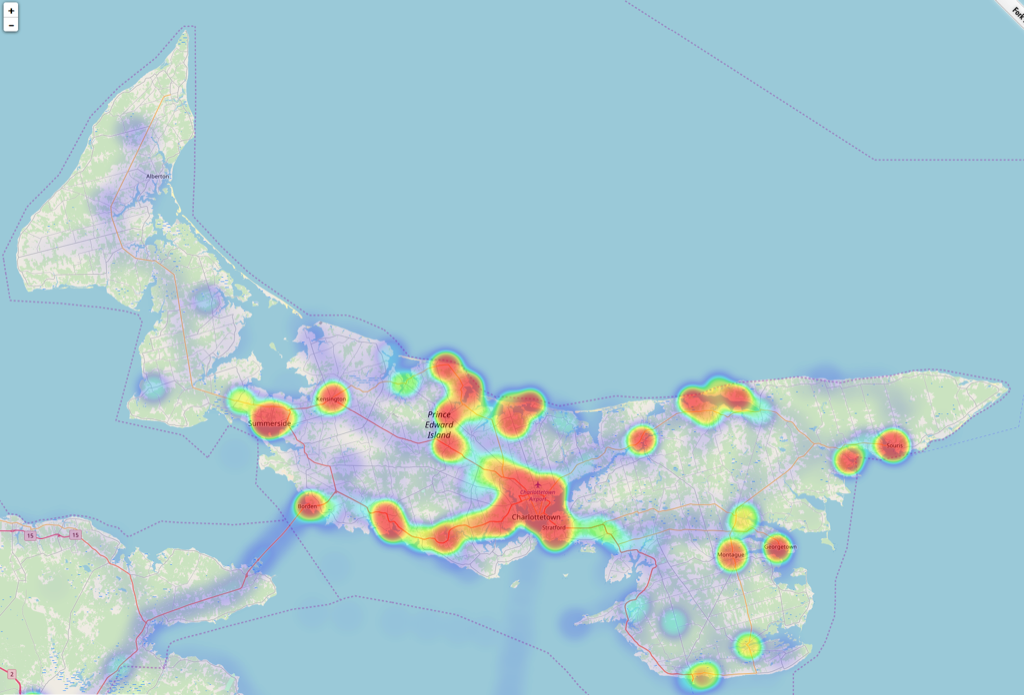
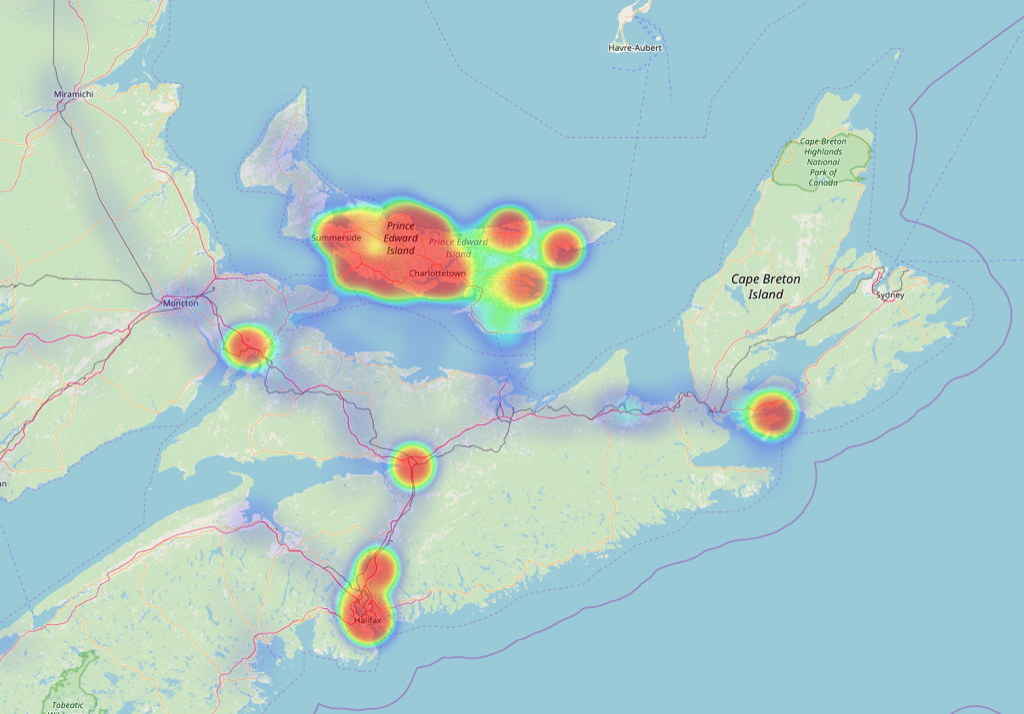
Moving from the detailed to the broad overview, there’s a handy open source tool called location-history-visualizer that allows a higher level exploration of the complete data set: operating entirely in the browser, it accepts the Google Takeout JSON file of location history, post-processes it, and then visualizes it on a map at any scale. I had a lot of fun exploring this map, and grabbed several screen shots showing the heatmap of my life at different levels.
Here’s Charlottetown, to start with. This heat map shows 8 years of my rambles around the city:
Moving outward, here’s Prince Edward Island over the same period:
Outward from PEI to Atlantic Canada:
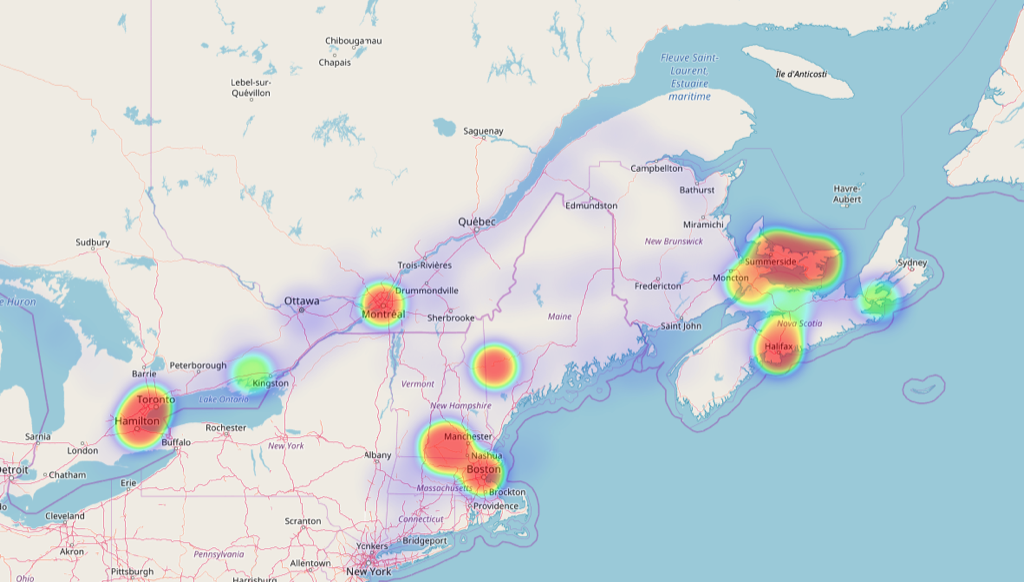
Here’s eastern North America, which shows my frequent travels to Boston and southern New Hampshire, to family in Montreal and Ontario and Napanee, as well as a week spent in a cottage in Maine:
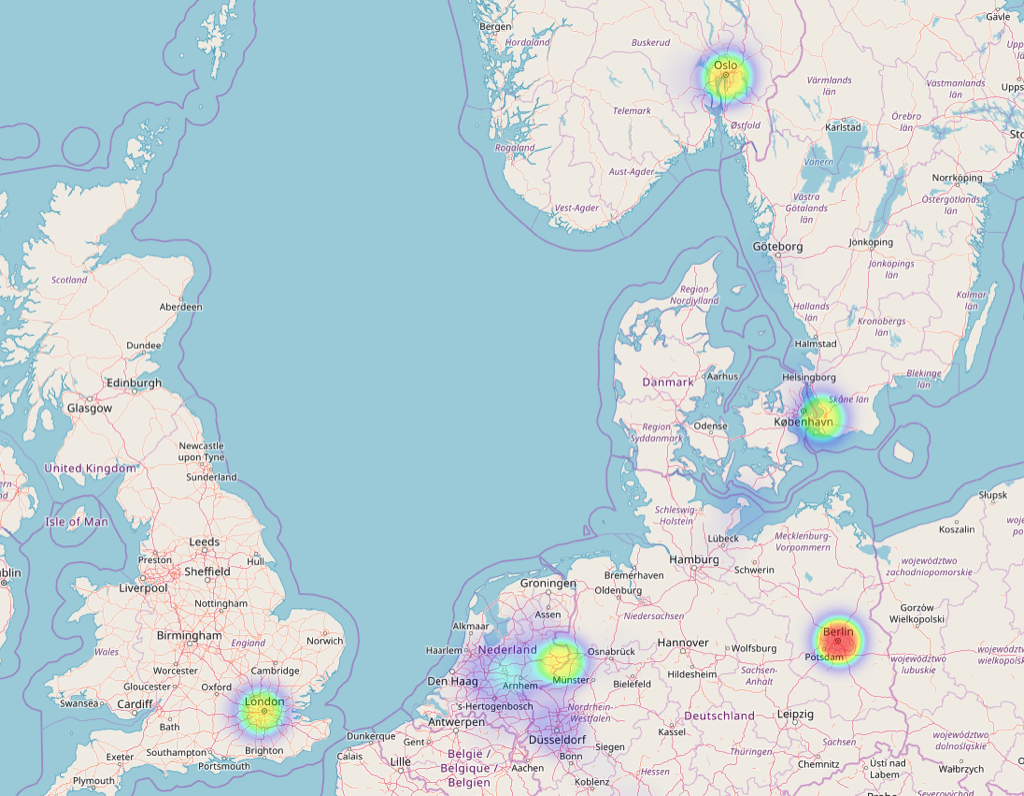
My European travels are not well-represented in the data, both because a lot that travel happened pre-2010, and because I didn’t always have data coverage on my more recent trips:
Finally, a global view, a view that, like Google’s own, shows clearly that my travels haven’t taken out out a 25 degree band of latitudes running from 35ºN (Tokyo) to 60ºN (Oslo). I’ve not been anywhere near south of the equator, nor anywhere east between Croatia and Japan:
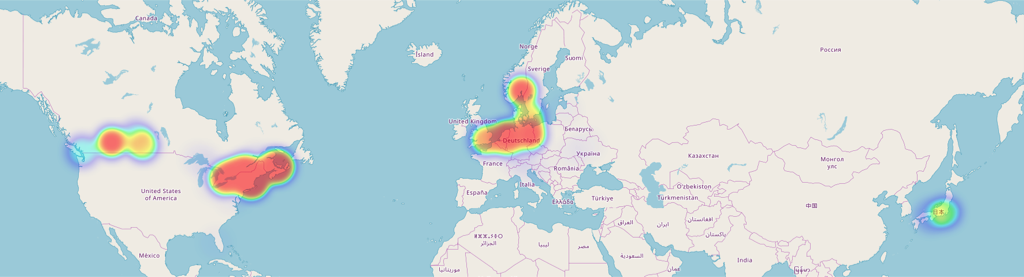
Truth be told, I have been further south (to Florida, 28ºN) and further east (to Kiev, 30ºE), but didn’t drop digital breadcrumbs there.
Squirreled away on my computer I have a richer collection of geolocation data gathered from other sources–Flickr, Foursquare, Here, Plazes and Twitter–running from 2004 to the present. I’ve long thought it would be an interesting project to come of with a way to convert all of that data into a common format to allow me to view it in aggregate; this incomplete slice of my heatmap through Google’s eyes might be the inspiration I need to finally do that.


 I am
I am  You can subscribe to an