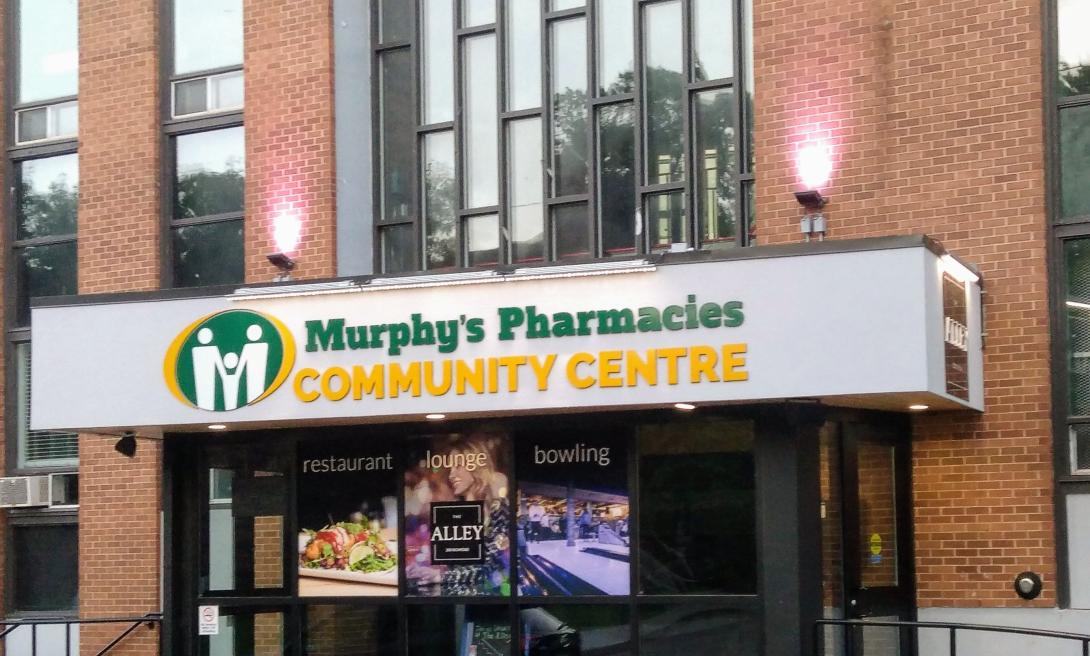
I’m prototyping in the shop this afternoon, figuring out imposition, how to maximize the number of sheets of 5 inch by 7 inch paper I can cut out of a larger sheet, and how to sew a binding.


I’m prototyping in the shop this afternoon, figuring out imposition, how to maximize the number of sheets of 5 inch by 7 inch paper I can cut out of a larger sheet, and how to sew a binding.
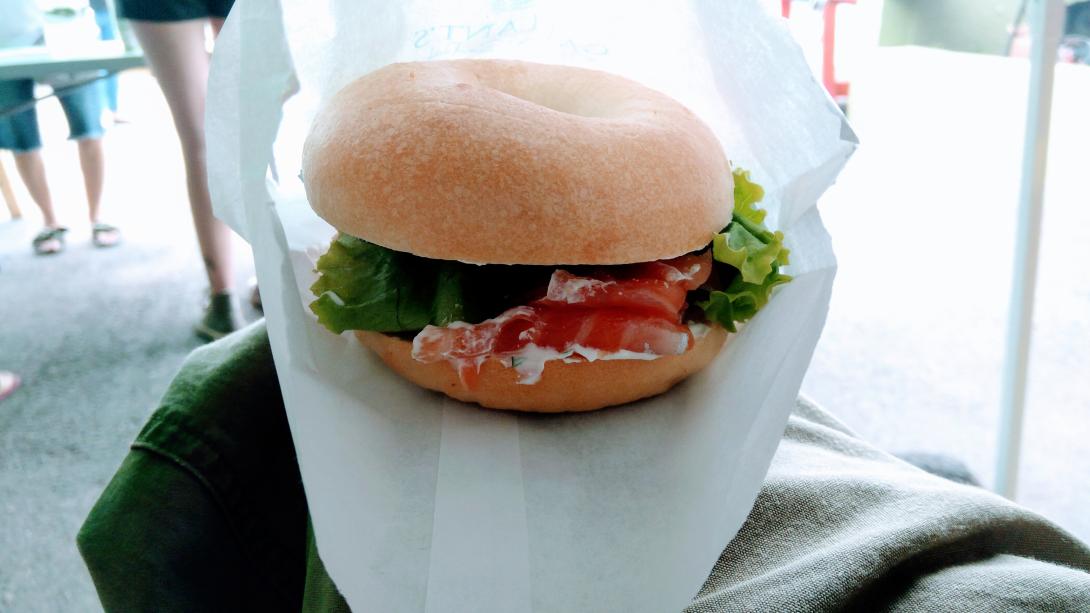
We arrived at the Charlottetown Farmers’ Market this morning to find Ross Munro’s bagel counter cleaned out and ready for a new vendor.
We had a brief moment of panic. And then saw the sign next door at Gallant’s offering salmon bagels: they’ve jumped in to fill the void.
Gallant’s offers a different take on the standard: they add cucumbers and lettuce, and, at least for now, they’re using citrus-cured salmon rather than smoked. They’re also using local bagels, crafted by Angel, which is a welcome first.
And so, as the Dormaar era gave way to the Munro era, so does the Munro era give way to the Gallant era.
We will miss our weekly visit with Ross’ kids, who gamely kept the booth going after Ross headed west for work. They were always friendly and helpful. The market won’t be the same without them.
An excellent story from JP Arsenault, whose blog I just connected with (thank you to James Randall at the Institute of Island Studies, where JP has just joined the Advisory Committee for that connection):
Anyone who has moved knows how challenging it can be to deal with the little things, like changes of address. During six months of homelessness, we’ve had no place but a P.O. Box to send mail. For most of the 25 or so organizations, government agencies, and businesses we deal with, not a problem. For a couple, however, the bank for example, it’s: “Sir, we need to have a physical address.” So I make something up; could be City Hall or the Lieutenant Governor’s Residence for all they care.
It reminds me of the day in September 1971 when I registered for my first term at the University of New Brunswick in Fredericton. The clerk at the Registrar’s Office took down all my particulars, then asked me for my phone number: “8”, I replied. “8? 8 what?” “Number 8 Wellington”, I said proudly. “There’s no such number”, says she. “Give me the phone and I’ll call my mother”, says I. So I did, and let her say hello to Yvonne. Another of life’s tiny triumphs for a kid from the sticks.
The Institute will be well-served by JP’s counsel.
The upside of owning the means of production is that you can create just-in-time. In this case I still have a week today until the Artist Trading Cards event at Confederation Centre of the Arts.
Here is a sneak peak of the type that will print part of my piece:
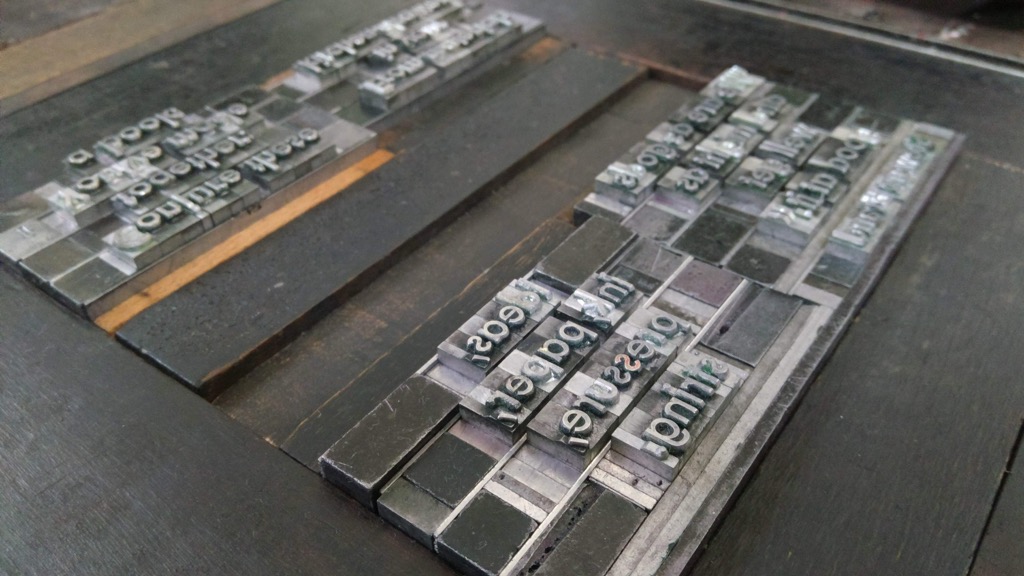
Although the “trader” deadline has passed, the event is open to everyone, of all ages, starting at 7:00 p.m. next Thursday, August 2, 2018, in the art gallery. There are snacks and the musical stylings of Todd E. MacLean.
Following on from yesterday’s experiments with visualizing street orientations, I set out to visualize just the streets of Charlottetown’s 500 Lot Area, the historic area at the core of the city, south of Euston Street from Government House to Joe Ghiz Park.
To be able to do that I first needed to create the 500 Lot Area in OpenStreetMap; I used Appendix J of the Charlottetown Zoning and Development Bylaw as my guide, and carefully traced the area as a boundary in the OpenStreetMap Editor; here’s the result:
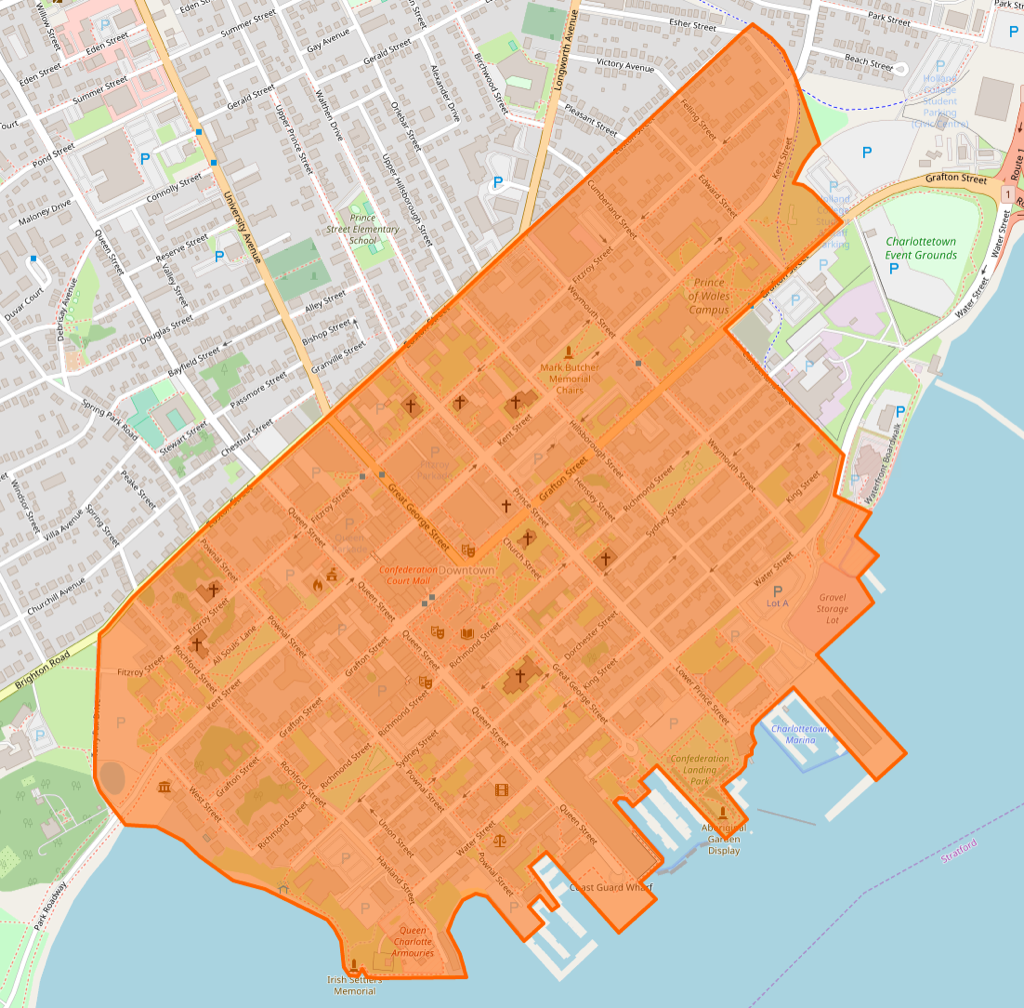
With the area in OpenStreetMap, I ran the same Python notebook code I ran yesterday, substituting this for the second step:
places = {'500 Lot Area'  : '500 Lot Area, Charlottetown, Canada',
          'Charlottetown'  : 'Charlottetown, PE, Canada'
}
The resulting visualization allows a comparison of Charlottetown as a whole with just the 500 Lot Area:
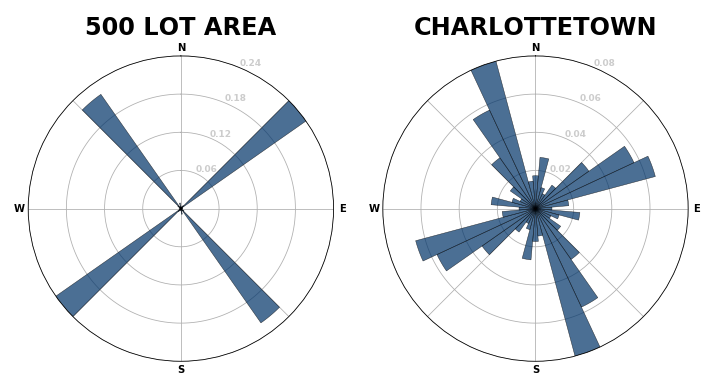
The difference illustrate how strictly orthogonal the historic core of Charlottetown is compared to the rest of the city: the downtown streets run at an angle just shy of 45 degrees from north-south and east-west.
For practical purposes this means that as you walk across the downtown, parallel to the water, you are walking northeast or southwest, and as you walk through the city, up or down between the water and Euston Street, you are walking northwest or southeast.
You have likely by now seen the buzz about Geoff Boeing’s work to visualize city street orientations.
There’s nothing more frustrating than coming across something interesting like this and not finding code attached to it, to allow one to apply it to local conditions; fortunately Boeing more than rose to the challenge, and provided a handy Python notebook that is relatively easy to get running on a Mac. After installing Jupyter and some Python libraries, I was able to run his code out of the box, changing only the definition of the cities to:
places = {'Charlottetown'   : 'Charlottetown, PE, Canada',
          'Summerside'      : 'Summerside, PE, Canada',
          'Stratford'       : 'Stratford, PE, Canada',
          'Cornwall'        : 'Cornwall, PE, Canada'
          }
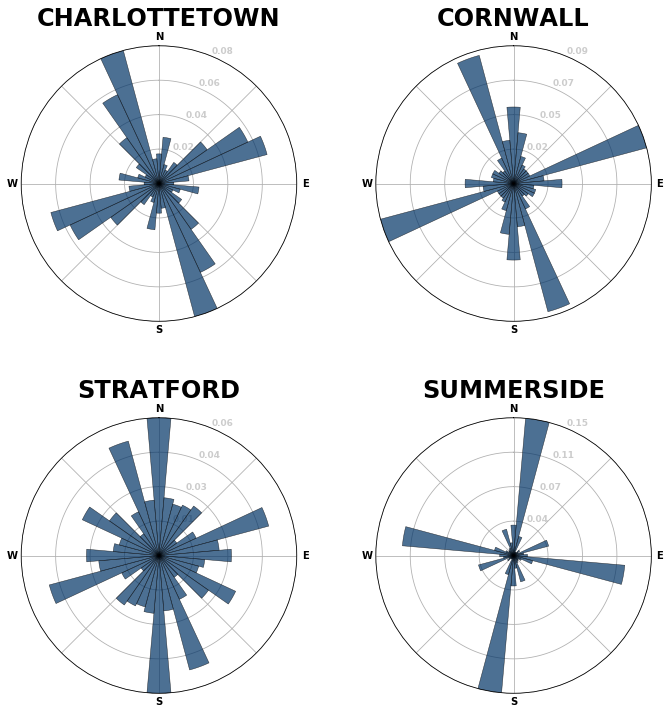
Less than a minute later, I had these beautiful visualizations:
Here’s how Boeing describes these:
Each of the cities above is represented by a polar histogram (aka rose diagram) depicting how its streets orient. Each bar’s direction represents the compass bearings of the streets (in that histogram bin) and its length represents the relative frequency of streets with those bearings.
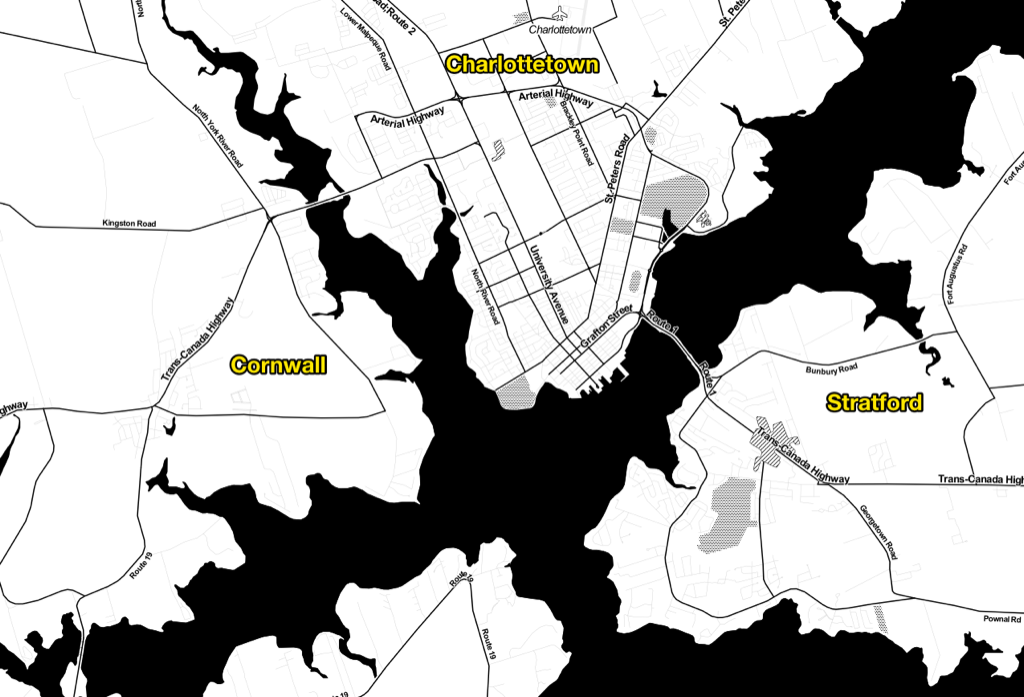
In other words, to generalize, Charlottetown and Cornwall follow what Boeing describes as an “angled, primarily orthogonal street grid,” rotated slightly west, with Cornwall including a significant north-south departure from this, and Charlottetown including a subset of streets tilted slightly east, reflecting the cohort of St. Peters Road-aligned streets on the east side of the city.
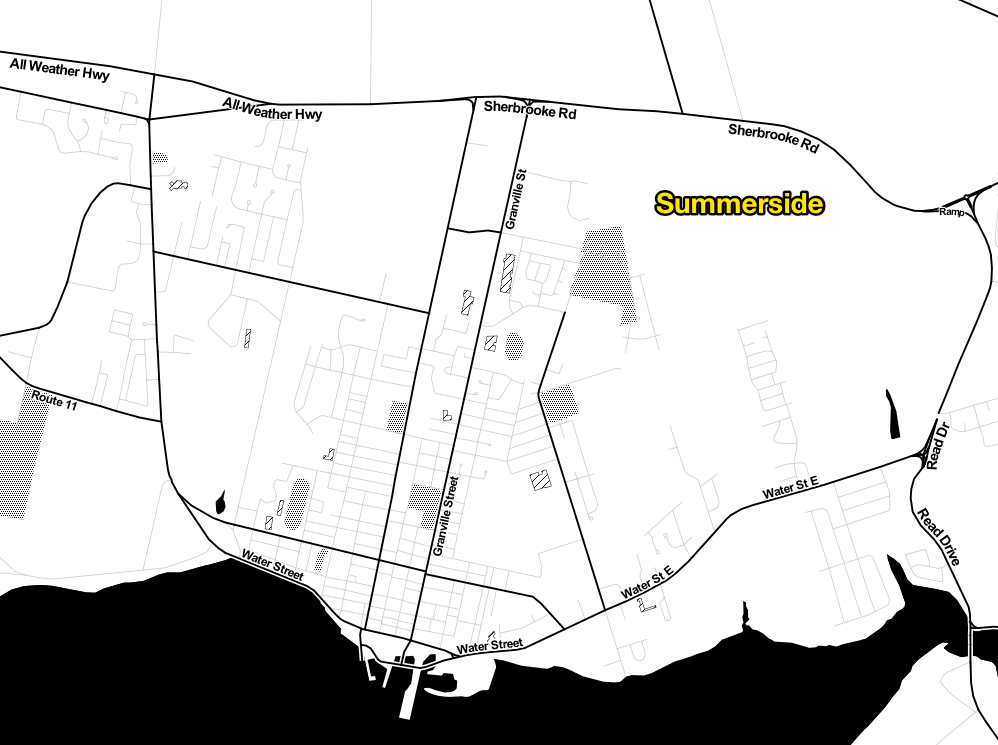
Summerside is even more religiously “angled, primarily orthogonal,” but rotated slightly east.
Stratford, on the other hand, is, as Boeing describes Boston and Charlotte, “more evenly distributed in every direction.”
This is all born out when you look at the street networks in OpenStreetMap, especially in the Stamen Toner style:
Of Boston, Boeing writes:
Although it features a grid in some neighborhoods like the Back Bay and South Boston, these grids tend to not be aligned with one another, resulting in a mish-mash of competing orientations. Furthermore, these grids are not ubiquitous and Boston’s other streets wind in many directions. If you’re going north and then take a right turn, you might know that you are immediately heading east, but it’s hard to know where you’re eventually really heading in the long run.
This makes it harder for unfamiliar visitors to navigate Boston than many other US cities. It does not adhere to a straightforward north-south-east-west pattern (or any other consistent, predictable pattern) that our brains adjust to in most places – not because Boston apocryphally paved over its cow paths, but because of its age, terrain, and annexation of various independent towns.
The same thing could just as well be said about Stratford, compared to the Charlottetown and Summerside.
It’s been a hot summer week here in Prince Edward Island: it’s 28ºC as I type this, and the temperature isn’t forecast to go lower than 18ºC for the next week, with daytime highs in the upper 20s:
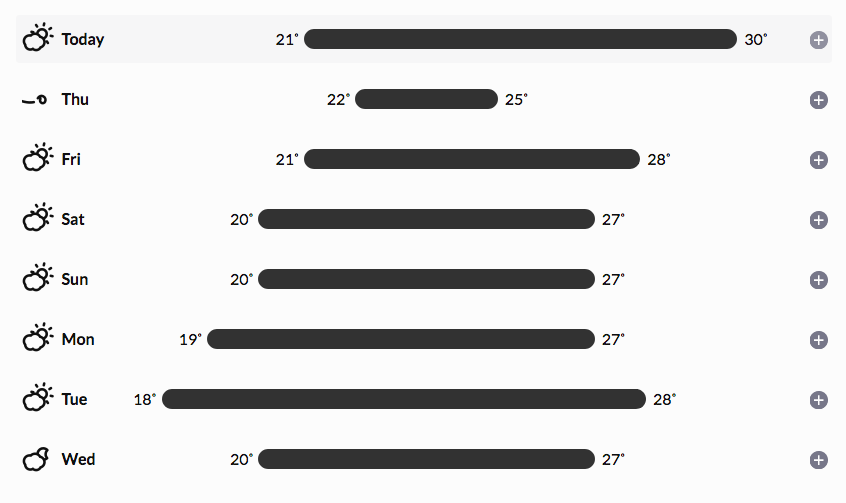
This heat, bolstered, I suspect, by the proliferation of air source heat pumps, has led to historic high electricity load for the province for the month of July; today’s peak, so far, is 217.48 MW, which is the highest load in July I’ve seen in the six years I’ve been archiving this data.
Indeed, of the 224,221 readings I’ve logged over 6 years, at 15 minute intervals, for PEI load and generation, the top 157 have been this month, and the previous July peak was in 2016 at 201.98 MW. That makes the 2018 peak 8% higher than the previous peak.
Here are the peak loads for the month of July for this year (so far) and for the previous five years, along with the peak temperature and the average daily temperature:
| Year | Peak Load | Peak Temperature | Average Temperature |
|---|---|---|---|
| 2018 | 217.48 MW | 30.11ºC | 20.11ºC |
| 2017 | 200.35 MW | 27.72ºC | 18.89ºC |
| 2016 | 201.98 MW | 28.11ºC | 18.89ºC |
| 2015 | 190.38 MW | 27.72ºC | 18.06ºC |
| 2014 | 196.72 MW | 29.00ºC | 21.00ºC |
| 2013 | 195.34 MW | 32.00ºC | 20.29ºC |
Note how the peak temperature and average daily temperature in 2013 were higher than this year, but the peak load was 22.14 MW (11%) higher.
Fortunately, at least for the last three days, we’ve been well-served by the wind, with wind generation accounting for as much as 93% of load (albeit in the middle of the night). As I type, in the early afternoon, generation from wind is a healthy 63%, despite the high load of 213 MW.
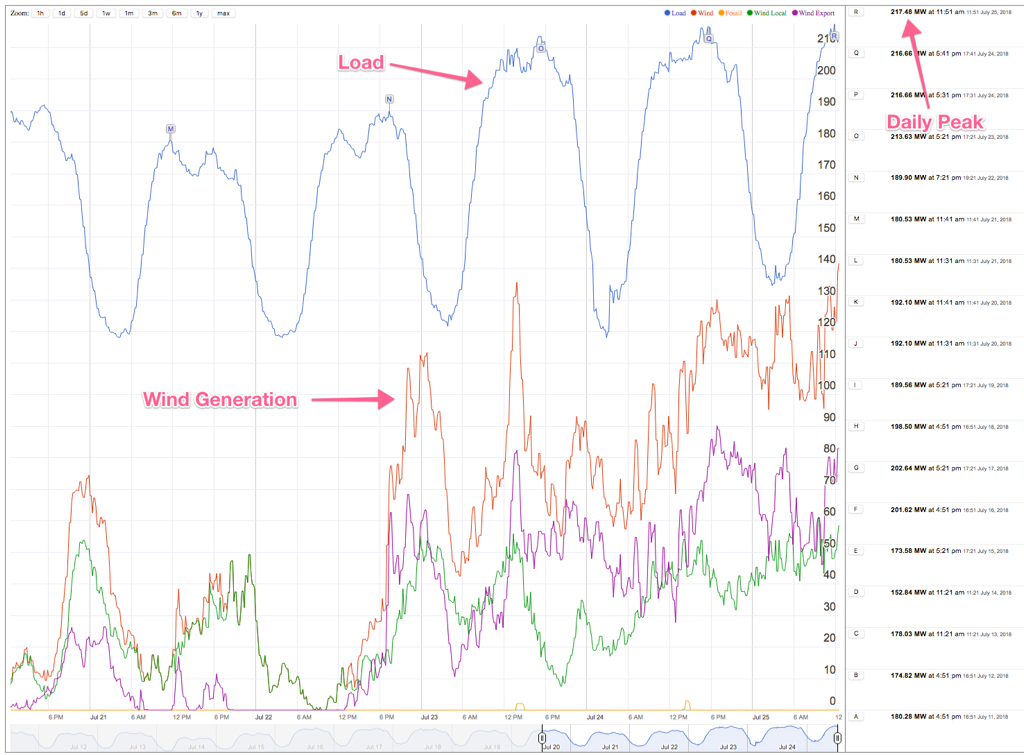
If you’re interested in seeing how the rest of the summer plays out, you can follow along with:
You could also use this time to ponder how you might cool your own spaces using less energy-intensive means (says the lucky fellow ensconced in his naturally cool church basement). Or you could, at the very least, transfer your cooling to the windy times of the day.
Being neighbour to the multi-year restoration of Province House means we have a unique opportunity to see the job site evolve over time.
With the transition from Phase 1, Erect the Exoskeleton to Phase 2, Fix the Structure, one contractor has given way to another, and so new temporary buildings and signage have gone up. To escape the summer heat indoors last night I went for a bike ride and, a Receiver Coffee iced tea in hand, I stopped on the park bench in front of 180 Richmond and sketched some of the new arrivals.
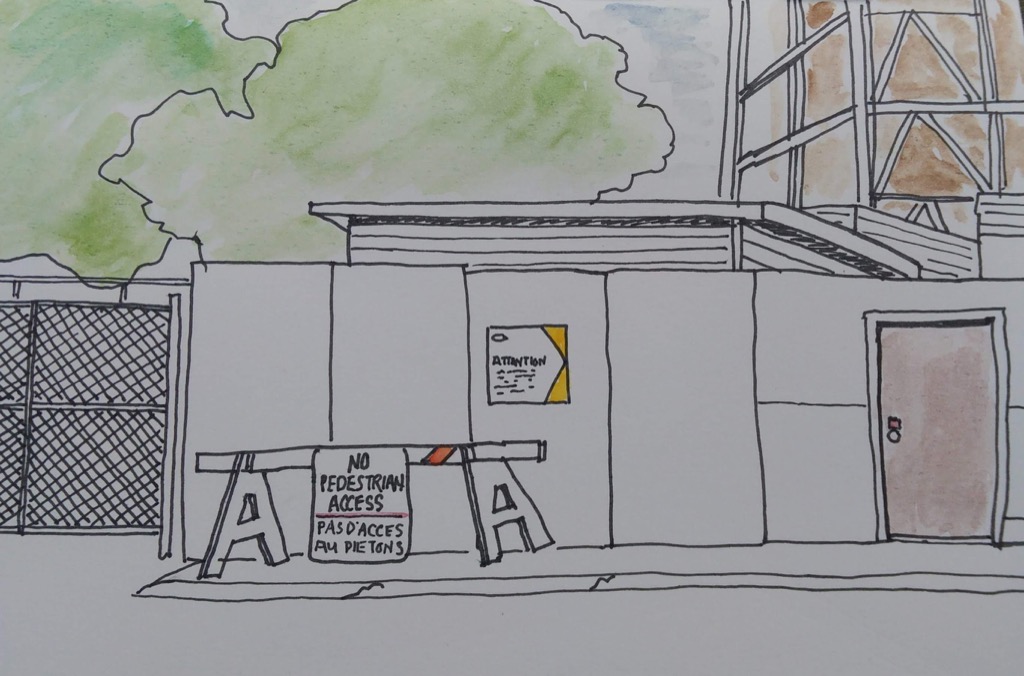
I’m proud of how close I came to getting the tricky angles of the “no pedestrian access” barrier down; less proud of the mess I made of the small part of the exoskeleton in the background. My favourite part is the orange swath.
My friend Valerie spends the summer on Prince Edward Island, or at least a part thereof, and in past summers we often find ourselves at summer’s end realizing that we didn’t get to see each other at all. And so this summer we got together on one of the first Wednesdays that the Charlottetown Farmers’ Market was open mid-week, and have managed to repeat that, by cunning happenstance, every Wednesday morning since.
The Market being the Market, we’ve been joined by Special Guest Stars every morning: Sandy one week, Ann another, Ray this week and last.
The Wednesday Farmers’ Market is a very different beast than the Saturday one, especially the summertime Saturday market, which, with its throngs of tourists, is reaching a conceptual breaking point (I’ve resolved, after railing up ideas like “no tourists before 11:00 a.m.” regulations, that I need to just accept and release and go with the flow). Not only are the aisles clear on Wednesdays, but everyone’s calmer, and vendors can spend more time chatting with customers.
Another way it’s different is that our breakfast smoked salmon bagel provider isn’t at the Market on Wednesdays, leaving me casting about for other options. Today I opted for waffles from The Breakfast Guy. This is not, in and of itself, remarkable but for the fact that in 25 years of going to the market, I’ve not only never been a customer of The Breakfast Guy, nor paid his booth any heed. Such is being a creature of habit. And such is the power of Wednesdays to help break that. The waffles, with a side of potato, were very good, and I will be back.
Unable to break character completely, post-waffles I had my usual iced tea from Lady Baker’s Tea and my usual once-a-week, now twice-a-week, chocolate from Katlin.
I washed up my coffee mug and, on the way back to return it, I found myself walking by Tim and Jen Allen Chaisson, and we exchanged hellos. As I am a superfan, this made my heart go thumpety-thump.
Before I knew what happened, it was closing in on 11:00 a.m. and there was work to be done, so I decamped back to the office.
 I am Peter Rukavina and this is my blog. I am a writer, letterpress printer, and a curious person.
To learn more about me, read my /now, look at my bio, listen to audio I’ve posted, read presentations and speeches I’ve written, see things I’ve favourited elsewhere, or get in touch (peter@rukavina.net is the quickest way).
I have been writing here since May 1999: you can explore the 25+ years of blog posts in the archive.
 You can subscribe to an RSS feed of posts, an RSS feed of comments, an RSS feed of favourites elsewhere, or a podcast RSS feed that just contains audio posts. You can also receive a daily digests of posts by email. I also publish an OPML blogroll.
Instagram • YouTube • Vimeo • ORCID • OpenStreetMap • Internet Archive • PEI.art • Drupal • Github.
 ,