From Pedro comes a pointer to Torino Colors:
Torino colors rappresenta un caso unico di mappatura urbana cromatica complementare a quella toponomastica. Un criterio intuitivo con cui è possibile orientarsi all’interno della città, migliorandone la fruizione, da parte di chi la vive, permanentemente o occasionalmente. Un unicum, ambizioso ed impegnativo, ma con ricadute, per l’immagine interna ed esterna della città, sicuramente straordinarie.
Or, for those of you not familiar with the Italian:

As Pedro describes it:
The Torino Colors project aims to change the way we navigate a city, the image I’ve reproduced here is the colored map for the Torino city in Italy. The idea behind it is very simple:
STEP 1: pick a color for each region of your town.
STEP 2: paint all the city appliances and structures (like trash bins, light posts, sign holders, etc.) with the corresponding color…
With a little twist and it’s here that this idea really get interesting:
STEP 3: As soon as you start moving in any direction, you add some blending to starting color, or simply put, when you walk in any certain direction towards another part of the city, the color will react to your movement and start to blend with the color selected for the region where you’re headed.
Anonymous friend of the blog Murky has created a much more interesting mix tape than the one that I threw together yesterday (although I would argue that my inclusion of a Fleetwood Mac track gives mine a certain kind of something). Listen:
Found here today: an MP3 of Nebulous by the Leslie Spit Treeo.
Back in my radio days, I had the Leslie Spit Treeo in the studio at Trent Radio for an interview. Somehow they ended up interviewing themselves, which was okay by me. Then then went next door to the Jolly Hangman and put on a barnburner of a show.
 One of the best experiences I’ve ever had buying clothing was the time I walked into Hambly & Innis Men’s Wear Clothing on University Avenue looking for a pair of pyjamas. Clarkie Innis sized me up, went into the back and found me a pair of flannels that I’m still wearing 10 years later. It felt like it was 1922.
I’ve walked by Hambly & Innis on my way to work almost every morning for as long as I can remember; although their stock was tilted about 30 years older than my demographic, rare is the day that I haven’t entertained the thought of finding a reason to by a fedora, or a yellow and blue checked spring jacket.
John Clark Innis died yesterday at the age of 94. His obituary reads:
A well known and respected Charlottetown businessman, John Clark “Clarkie” Innis, died on Wednesday, March 26th, 2008 at the Queen Elizabeth Hospital. He was 94 years of age.
Both Clarkie and his son Kenny operated a very successful Hambly & Innis Men’s Wear Clothing Store in downtown Charlottetown with a history that dates back to its inception in 1949. Up until recently he worked in the day-to-day operation of the family business.
Mr. Innis was the beloved husband of the late Kathleen “Kay” (nee Acorn) Innis, and dear father of Gloria (Ross) Gilmore of Dartmouth, NS and Ken (Pauline) Innis of Charlottetown. He will also be sadly missed but fondly remembered by his grandchildren, Jason (Karen) Gilmore, Jill Gilmore both of Dartmouth, Ryan Innis and Kyle Innis both of Charlottetown; and his numerous nieces and nephews.
The last surviving member of his family, he was predeceased by his parents, Roderick and Laura Jane (Clark) Innis, sisters and brothers, Arabelle Baillie of California, Charles Innis of Ontario, Jean Grenier of BC, Eleanor Innis and Smith “Doc” Innis both of Pictou County, NS.
As Hambly & Innis closes — as The Guardian reported this morning — Charlottetown will lose its last real haberdashery and, in Clarkie Innis, it’s last real haberdasher.
Thoughts tonight to his friends and family.
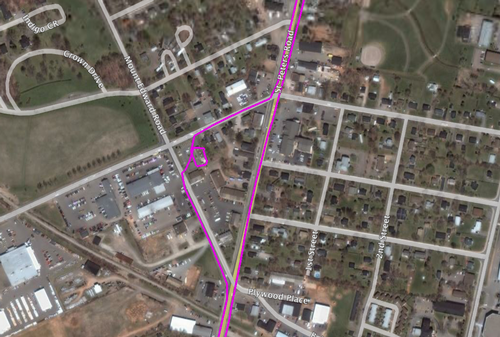
The lads and I took a run out to the shore this afternoon on a secret recon mission. My GPS receiver was streaming position to my phone all the way, and the image below is a chunk of track, superimposed on Google Earth. Can you identify our stop on the way back into town?

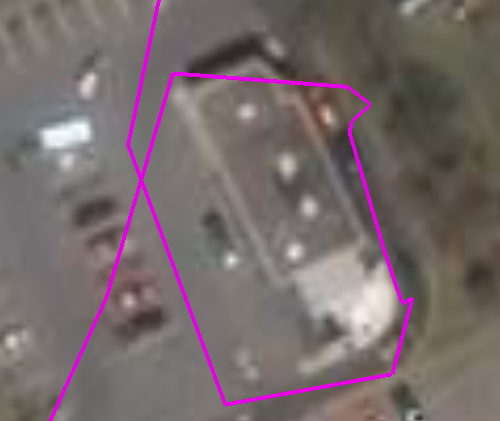
Here’s a close-up:

Here’s the Google Earth KML file of the entire trip if you want to see it in living globe.
Amid the torrent of snazzola that flows through my RSS every day Mixwit stood out. I am marking my age by admitting so, of course: I can only imagine that 4 or 5 generations of kids have grown up who’ve no idea what a cassette tape even looks like. But I found the process of putting a virtual one together completely compelling. Here’s what I came up with:
Moving on from yesterday’s brief overview of immigrant populations in selected PEI places, I did a little hacking today to extract data for all of Prince Edward Island’s 109 Census Subdivisions (there are actually 113, but the Lennox Island, Rocky Point, Morell and Scotchfort subdivisions don’t have immigration data).
My assumption going in was that Charlottetown, of course, would have the highest proportion of immigrants (I have nothing to base this on by anecdotal information and perhaps a limited view of who’s an “immigrant”). Turns out that Charlottetown is ranked #25, and is surpassed by such cosmopolitan enclaves as Montague, Kinkora, Miminegash.
The most immigrant-rich area of PEI? Lot 30. It’s a thin sliver of a census subdivision that runs up from the shore between Clyde River and Victoria, and includes parts of St. Catherines and Brookvale. 12.5% of the population in Lot 30 are immigrants (95 of 760 residents).
The second most immigrant-rich area is Lot 58, another thin census subdivision that runs along the eastern half of Point Prim and inland.
Here’s a table showing the all of PEI’s census subdivisions, sorted in descending order of the percentage immigrant population. The data is from the 2006 Census Community Profiles.
| Rank | Name | Population | Immigrants | Percentage |
|---|---|---|---|---|
| 1 | Lot 30 | 760 | 95 | 12.50% |
| 2 | Lot 58 | 525 | 65 | 12.38% |
| 3 | Sherbrooke | 130 | 15 | 11.54% |
| 4 | Lot 22 | 580 | 55 | 9.48% |
| 5 | Breadalbane | 175 | 15 | 8.57% |
| 6 | Lot 62 | 540 | 45 | 8.33% |
| 7 | Lot 52 | 825 | 65 | 7.88% |
| 8 | Lot 57 | 950 | 70 | 7.37% |
| 9 | Lot 24 | 1570 | 105 | 6.69% |
| 10 | Montague | 1735 | 115 | 6.63% |
| 11 | Kinkora | 325 | 20 | 6.15% |
| 12 | Lot 38 | 500 | 30 | 6.00% |
| 13 | Lot 33 | 1085 | 65 | 5.99% |
| 14 | Lot 66 | 170 | 10 | 5.88% |
| 15 | Lot 12 | 875 | 50 | 5.71% |
| 16 | Miminegash | 175 | 10 | 5.71% |
| 17 | Stratford | 7080 | 385 | 5.44% |
| 18 | Meadowbank | 370 | 20 | 5.41% |
| 19 | Lot 41 | 470 | 25 | 5.32% |
| 20 | Crapaud | 305 | 15 | 4.92% |
| 21 | Clyde River | 615 | 30 | 4.88% |
| 22 | Lot 29 | 935 | 45 | 4.81% |
| 23 | Miltonvale Park | 1145 | 55 | 4.80% |
| 24 | Charlottetown | 31295 | 1480 | 4.73% |
| 25 | Lot 60 | 320 | 15 | 4.69% |
| 26 | Lot 50 | 855 | 40 | 4.68% |
| 27 | Lot 36 | 750 | 35 | 4.67% |
| 28 | Lot 37 | 540 | 25 | 4.63% |
| 29 | Lot 43 | 775 | 35 | 4.52% |
| 30 | Lot 31 | 1615 | 70 | 4.33% |
| 31 | Lot 51 | 810 | 35 | 4.32% |
| 32 | Lot 49 | 1045 | 45 | 4.31% |
| 33 | Lot 65 | 2050 | 85 | 4.15% |
| 34 | Lot 35 | 1605 | 65 | 4.05% |
| 35 | Hunter River | 250 | 10 | 4.00% |
| 36 | Lot 25 | 1155 | 45 | 3.90% |
| 37 | Lot 18 | 1055 | 40 | 3.79% |
| 38 | Lot 21 | 955 | 35 | 3.66% |
| 39 | Lot 48 | 1790 | 65 | 3.63% |
| 40 | Lot 23 | 835 | 30 | 3.59% |
| 41 | Resort Municipality | 280 | 10 | 3.57% |
| 42 | Kings | 290 | 10 | 3.45% |
| 43 | Lot 56 | 445 | 15 | 3.37% |
| 44 | Lot 63 | 900 | 30 | 3.33% |
| 45 | Lot 64 | 930 | 30 | 3.23% |
| 46 | Summerside | 14270 | 460 | 3.22% |
| 47 | Lot 40 | 475 | 15 | 3.16% |
| 48 | Warren Grove | 335 | 10 | 2.99% |
| 49 | Lot 67 | 845 | 25 | 2.96% |
| 50 | Lot 9 | 360 | 10 | 2.78% |
| 51 | Murray Harbour | 360 | 10 | 2.78% |
| 52 | Lot 34 | 2355 | 60 | 2.55% |
| 53 | Lot 14 | 795 | 20 | 2.52% |
| 54 | Alberton | 1030 | 25 | 2.43% |
| 55 | Lot 61 | 830 | 20 | 2.41% |
| 56 | Georgetown | 625 | 15 | 2.40% |
| 57 | Murray River | 430 | 10 | 2.33% |
| 58 | Lot 53 | 435 | 10 | 2.30% |
| 58 | Lot 54 | 435 | 10 | 2.30% |
| 59 | Lot 28 | 885 | 20 | 2.26% |
| 60 | Souris | 1160 | 25 | 2.16% |
| 61 | Cornwall | 4675 | 100 | 2.14% |
| 62 | Lot 13 | 720 | 15 | 2.08% |
| 63 | Kensington | 1485 | 30 | 2.02% |
| 64 | Lot 47 | 515 | 10 | 1.94% |
| 65 | Lot 11 | 520 | 10 | 1.92% |
| 66 | Lot 27 | 825 | 15 | 1.82% |
| 67 | Lot 7 | 565 | 10 | 1.77% |
| 68 | North Rustico | 600 | 10 | 1.67% |
| 69 | Lot 5 | 1250 | 20 | 1.60% |
| 70 | Lot 26 | 1000 | 15 | 1.50% |
| 71 | Tignish | 720 | 10 | 1.39% |
| 72 | O’Leary | 835 | 10 | 1.19% |
| 73 | Lot 4 | 1175 | 10 | 0.85% |
| 74 | Lot 15 | 1210 | 10 | 0.83% |
| 75 | Lot 59 | 1230 | 10 | 0.81% |
| 76 | Lot 1 | 1880 | 15 | 0.80% |
| 77 | Lot 2 | 1655 | 10 | 0.60% |
| 78 | Lot 19 | 1875 | 10 | 0.53% |
| 79 | Abrams Village | 265 | 0 | 0.00% |
| 79 | Bedeque | 130 | 0 | 0.00% |
| 79 | Borden-Carleton | 785 | 0 | 0.00% |
| 79 | Brackley | 335 | 0 | 0.00% |
| 79 | Cardigan | 370 | 0 | 0.00% |
| 79 | Central Bedeque | 150 | 0 | 0.00% |
| 79 | Linkletter | 320 | 0 | 0.00% |
| 79 | Lot 10 | 295 | 0 | 0.00% |
| 79 | Lot 16 | 700 | 0 | 0.00% |
| 79 | Lot 17 | 565 | 0 | 0.00% |
| 79 | Lot 20 | 750 | 0 | 0.00% |
| 79 | Lot 3 | 900 | 0 | 0.00% |
| 79 | Lot 39 | 655 | 0 | 0.00% |
| 79 | Lot 42 | 300 | 0 | 0.00% |
| 79 | Lot 44 | 865 | 0 | 0.00% |
| 79 | Lot 45 | 500 | 0 | 0.00% |
| 79 | Lot 46 | 400 | 0 | 0.00% |
| 79 | Lot 55 | 400 | 0 | 0.00% |
| 79 | Lot 6 | 855 | 0 | 0.00% |
| 79 | Lot 8 | 665 | 0 | 0.00% |
| 79 | Miscouche | 760 | 0 | 0.00% |
| 79 | Morell | 305 | 0 | 0.00% |
| 79 | Mount Stewart | 260 | 0 | 0.00% |
| 79 | St. Louis | 80 | 0 | 0.00% |
| 79 | St. Peters Bay | 245 | 0 | 0.00% |
| 79 | Tyne Valley | 205 | 0 | 0.00% |
| 79 | Union Road | 245 | 0 | 0.00% |
| 79 | Victoria | 75 | 0 | 0.00% |
| 79 | Wellington | 400 | 0 | 0.00% |
| 79 | Winsloe South | 180 | 0 | 0.00% |
There’s a really cool diagram in the 2006 Census Boundary Files Reference Guide for Canada that shows the geographical hierarchy they use:

I like how there’s a special classification for the “rural fringe” and “urban fringe.” Presumably these are special classes for gun owners and bicyclists respectively.
For a more detailed Charlottetown perspective, see Downtown Charlottetown Statistical Information in the Rukapedia.


 I am
I am