
The Guardian reports that reporter Nigel Armstrong died last night.
Although I didn’t know Nigel well, our paths crossed many times over the years on matters journalistic, especially when Nigel became responsible for the paper’s website.
My favourite of all the journalistic things Nigel did over the years was his story from 2014 about a bus, a gas tank, a fire-eater, and a cat:
Watching the whole proceeding with a sense of irony was a fire-eating busker who gave her performance name of Ariane Pyromane, her last name being the French equivalent of pyromaniac or arsonist.
She just arrived on P.E.I. from Montreal Monday with her cat TouTou, her guitar, and her fire eating hoops and gear.
She was strumming a tune on a park bench in front of Confederation Centre when she heard a sort of explosion just meters away.
“The bus kind of lifted a little bit in the air and then all the gas started spilling everywhere,” said Ariane. “There was no fire, only a little bit of smoke.”
TouTou remained unimpressed and Ariane kept on busking as firefighters and police arrived on scene.
I came across the story again last year and I emailed Nigel to thank him for it; he replied:
I remember now that I came back to the office smiling and full of excitement to craft a good one with that good material.
And he did.
Nigel was one of the good ones, and the Island is greatly diminished by his death.
I was washing my hands late last night at Green HQ, and found a bar of soap beside the sink:

When I turned the light off to leave, I noticed that the soap was glowing green:

Apparently there is so much Green energy in the place that it’s infused itself into the soap.
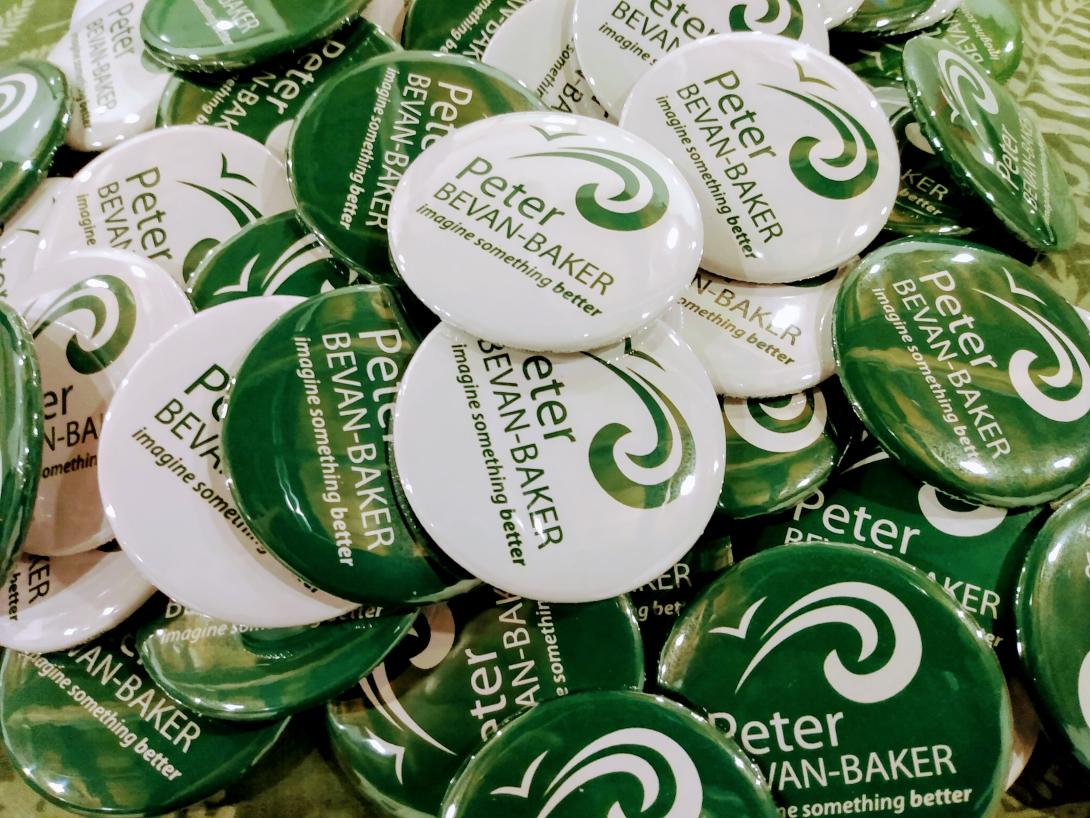
The output for tonight from our family campaign button making efforts.
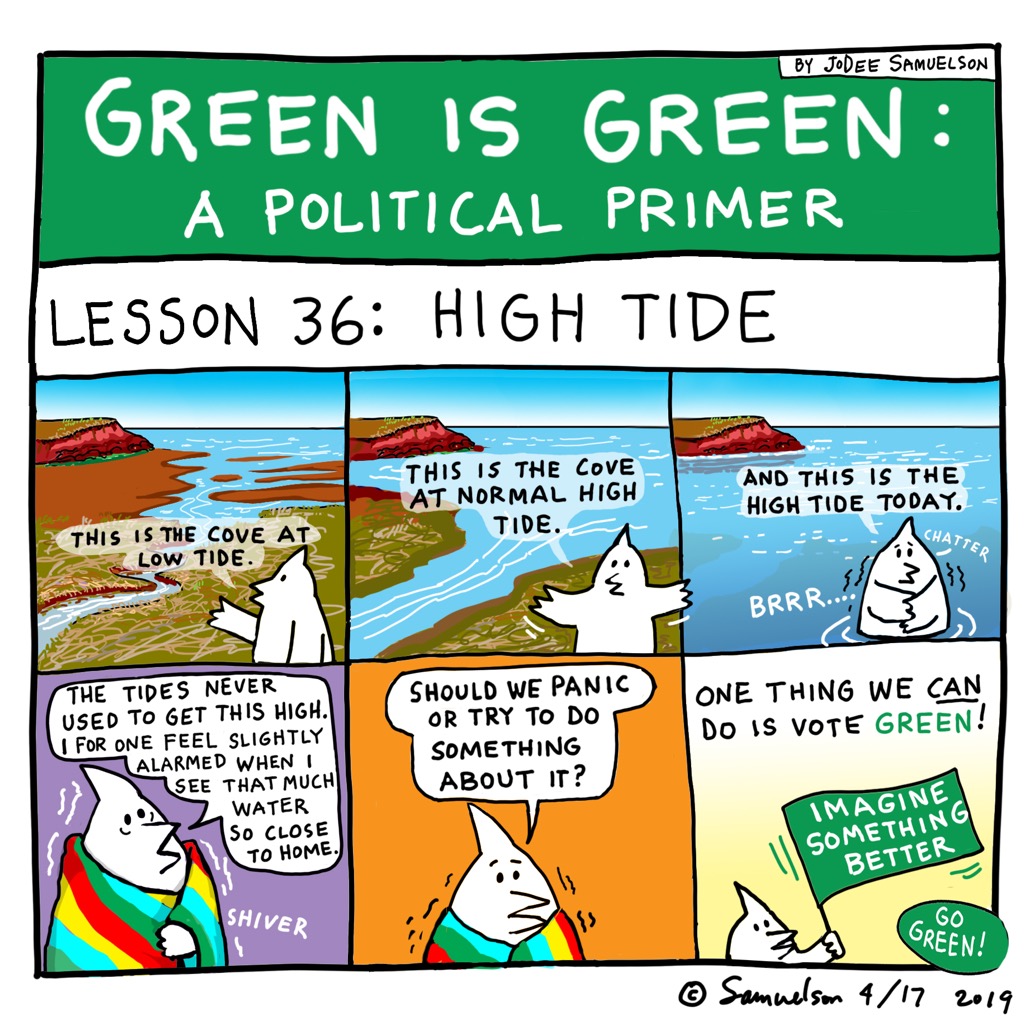
I ran into Jo Dee Samuelson in Summerside on Monday night and she mentioned that she’s been producing comics for the Green Party; I hadn’t seen any of them because the only place they “run” is on social media. So she generously agreed to email them along; here’s the latest (appearing here with her permission):
Giving up Sunday morning waffles is, in our family, the greatest sacrifice; I have gone as far as rearranging air tickets so as to ensure my Sunday morning waffle-making availability.
But this Sunday morning there was a call for Green Party supporters to travel out to Brookvale for a video shoot, and Oliver and I resolved to attend, setting waffles aside for a week so as to ensure a better future for our grandchildren.
It was a lovely spring day, and among the ragtag crowd of Greens were many friends.
Alas a video shoot is, it turns out, filled with many strict instructions: go here, do this, don’t stand so close, shout this, look that way.
Delivered, I must say, with kindness by the director. But strict instructions nonetheless, and, on a waffleless Sunday morning enough of a source of anxiety that, when he ended up stepping on Ethan the Dog amidst their execution, Oliver tipped over into irreversible anxiety and we escaped back to town. Beyond the stress of the go-here-do-this, Oliver’s primary concern on the drive home was that he would be kicked out of the Green Party for violating the Culture of Peace core value, and it took a lot of convincing to convince him that getting freaked out by something isn’t an act of violence, even if it does involve walloping your father.
I sought reassurances, on Oliver’s behalf, that his party membership was secure and, when this was forthcoming, he and Catherine, after lunch, decamped to Green HQ to make some flags for a Monday night rally in Summerside. After supper, Oliver and I went back and powered through a bunch of campaign button-making in service to the same event.
By Monday morning the halo of anxiety was staunched, and all was calm.
Late last week I’d signed up for “drive voters to the polls” duty on a lark; after working in the digital engine room of the campaign for the past couple of weeks, I had an appetite for meeting actual electors, and I thought driving duty would be a handy conceit. On the space on the online form where I was asked to indicate the furthest distance I would be willing to drive to get someone to the polls, I cheekily entered “an infinite distance.” So I could hardly be surprised when the call came to drive out to Hunter River on Monday morning for 10:00 a.m.; not quite an infinite distance, but proof that cheekiness comes at a cost.

Regardless of the infinite distance of Hunter River from town, I thoroughly enjoyed the experience: my passenger-voter and I had a good chat on the way there and back, and I ended up giving them a referral to Dave’s Service Centre, as, in addition to needing a new government and a better future, they also needed a good mechanic.
After a return to civilian life for the rest of the morning, I found myself finishing up lunch at Mad Wok facing a soggy walk back to the Reinventorium, as it was raining cats and dogs, so I made the best of a bad situation and ran through the rain, around the corner to Green HQ, and made another cache of buttons for the Summerside rally.
A friendly Green gave me a ride back to the office an hour later, and after getting some more paid work done, just before 5:00 p.m. I went home, collected Oliver, and headed off to the advance poll so I could vote (I was mindful of how I forgot to vote in 2003 in the Hurricane Election, and I couldn’t conscience a repeat of that).
After voting, Oliver and I headed up to the Farm Centre to set up chairs for Tuesday’s lunch with Elizabeth May, an experience facilitated by excellent instructions from Volunteer Coordinator Barbara. We made quick work of the rearrangement; when we left the hall looked like this:
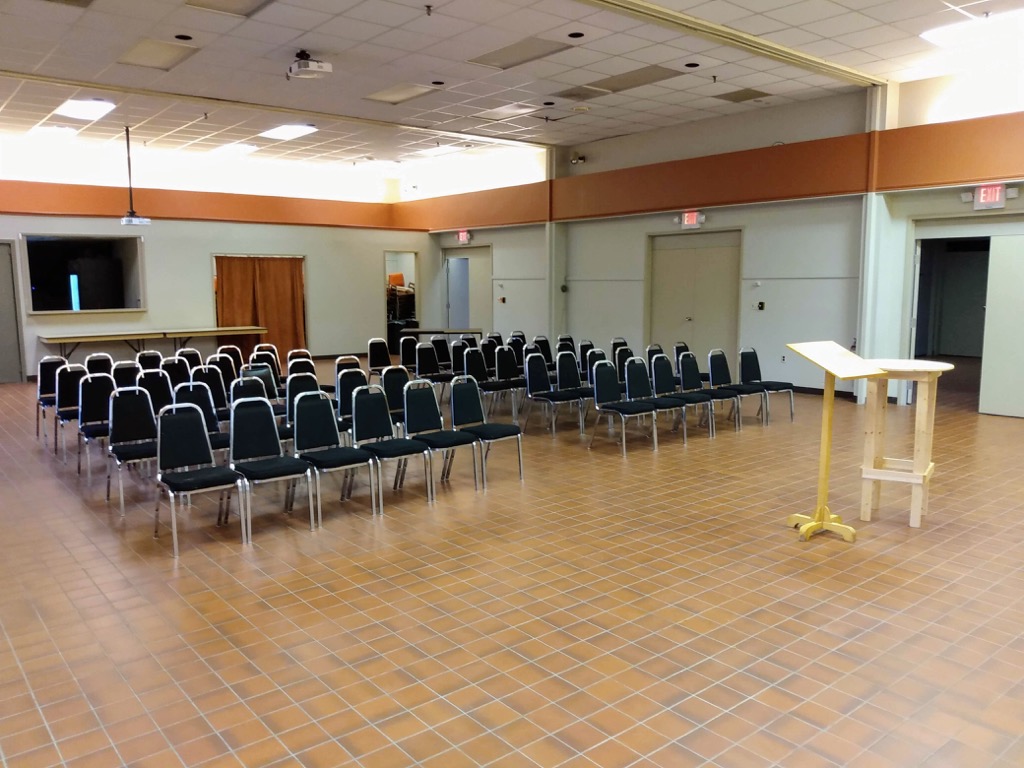
It was the perfect job for two people like us who like lining things up in rows.
All across Prince Edward Island there are Green volunteers driving people to the polls, making campaign buttons and setting up chairs in their local hall, most of them devoting many more hours in the day than I’ve been able to afford. Watching all this happening, and dipping my toe in its waters, has been a revelation to me: heretofore I’d never seen myself as part of the group of people who does things like this; I’d simply assumed there were people–other people–who handled it. It turns out that the people who put up the chairs, and make the buttons and the flags, and drive people to the polls, is us.
That will be the signature takeaway for me from this campaign; it’s also a pretty good metaphor for why I’m doing all of this, contrary to type: the revelation, which I keep returning to, that “there’s no us and them, there is only us.” In other words, If I don’t like the way things are working, it’s up to me to step forward, set up the chairs, and help develop a plan to make them work better.
After setting up the chairs, Oliver and I hopped back in the car and drove up to Summerside for the rally at the College of Piping (it was only my third such event: I went to an Ann Richards rally in El Paso, Texas in 1990, and, before that, a Pierre Trudeau rally in Hamilton, Ontario in 1980). There were speeches and songs and fundraising and more songs. I got to hear Elizabeth May speak for the first time (she was, I must say, a fantastic orator). And we met a woman named Beulah and her husband, sitting next to Oliver, and had a nice chat.
When the rally was over we got back in the car and drove the misty 50 km back to Charlottetown, talking about politics and voting and Oliver’s popular music appreciation course in school. And that has been the other gift this campaign has given me, the gift of being able to work along side my son on a project that we’re both passionate about.
This is turning out to be a very interesting week.
This interactive light pollution map is a visual proxy for human development and electrification; here’s a screen shot of Prince Edward Island’s light pollution:
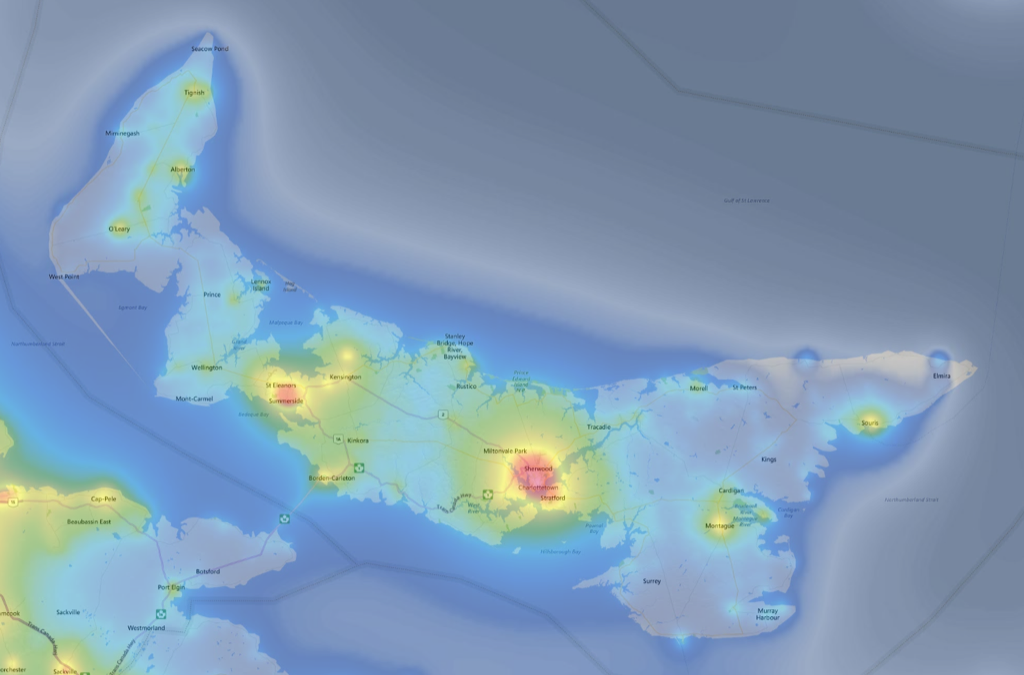
Link via Dense Discovery № 32.
After I built the Find your Green Candidate tool a couple of weeks ago, the next step was to expand this into a full-fledged Where to Vote Green tool (or, if you prefer, Où voter Vert).
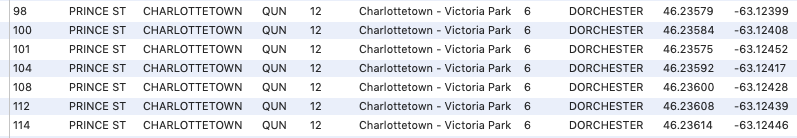
From building the candidate-finder I already had a ready-made source of information about which civic addresses on Prince Edward Island are in which electoral districts and polls; because I wanted to be able to provide driving directions to polling stations, I added a latitude and longitude column to this table so that, for each address, there’s a row that include street number, street name, community, district, poll and geolocation:
Next I needed information on the advance and regular polling stations for each of the 240 polling divisions. Finding no open data source for this information, I manually mangled the Elections PEI 2019 Provincial General Election Polling Location page into a database table. Because the civic addresses on that page were in various formats, I had to do some manual normalization, looking up each civic address in the civic address database, and transcribing the proper address, latitude and longitude for each (some districts use the same polling station for every poll, so, thankfully, I didn’t have to do this 240 times).
Once I’d done this, I had a complete record for each poll; here’s the data for my own poll, District 12, Poll 6, for example:
- District Number: 12
- District Name: Charlottetown - Victoria Park
- Poll Number: 6
- Poll Name: DORCHESTER
- Advance Poll Location: Charlottetown Event Grounds
- Advance Poll Address: 360 GRAFTON ST, CHARLOTTETOWN
- Advance Poll Geolocation: 46.24121, -63.11709
- Regular Poll Location: Central Christian Church
- Regular Poll Address: 223 KENT ST, CHARLOTTETOWN
- Regular Poll Geolocation: 46.23809, -63.12490
There’s 2,400 pieces of information altogether, and it all needed to be double-checked against Elections PEI’s data; fortunately there was a volunteer down at HQ who was able to apply a second pair of eyes to this.
With all that I had everything I needed to create a tool to allow voters to enter their civic address and get information about their candidate: the rest of the work involved designing the tool itself, ensuring that it works on both desktop and mobile, ensuring it’s fast enough to be useful, and that the results are presented clearly.
The tool works by watching the address field for the “keyup” event, and sending the current contents of the field to an API I created to look up the address; the API returns the first 4 civic addresses that match what it receives, as a chunk of HTML; for example, it the API receives 100 PRINCE it returns:
<ul id="addresslist"><li class="oneaddress" id="eyJzdHJlZXRfbm8iOiIxMDAiLCJzdHJlZXRfbm0iOiJQUklOQ0UgU1QiLCJjb21tX25tIjoiQ0hBUkxPVFRFVE9XTiIsImxhdGl0dWRlIjoiNDYuMjM1ODQiLCJsb25naXR1ZGUiOiItNjMuMTI0MDgiLCJkaXN0X25vIjoiMTIiLCJkaXN0cmljdCI6IkNoYXJsb3R0ZXRvd24gLSBWaWN0b3JpYSBQYXJrIiwicG9sbF9ubyI6IjYiLCJjYW5kaWRhdGUiOiJLYXJsYSBCZXJuYXJkIiwidXJsIjoiaHR0cHM6XC9cL3d3dy5ncmVlbnBhcnR5LnBlLmNhXC9rYXJsYWJlcm5hcmRfZDEyIiwicGhvdG8iOiJzbWFsbGVyX2thcmxhX2Jlcm5hcmQucG5nIiwiYWR2YW5jZSI6IkNoYXJsb3R0ZXRvd24gRXZlbnQgR3JvdW5kcyIsImFkdmFuY2VfYWRkcmVzcyI6IjM2MCBHUkFGVE9OIFNULCBDSEFSTE9UVEVUT1dOIiwiYWR2YW5jZV9sYXRpdHVkZSI6IjQ2LjI0MTIxIiwiYWR2YW5jZV9sb25naXR1ZGUiOiItNjMuMTE3MDkiLCJwb2xsaW5nIjoiQ2VudHJhbCBDaHJpc3RpYW4gQ2h1cmNoIiwicG9sbGluZ19hZGRyZXNzIjoiMjIzIEtFTlQgU1QsIENIQVJMT1RURVRPV04iLCJwb2xsaW5nX2xhdGl0dWRlIjoiNDYuMjM4MDkiLCJwb2xsaW5nX2xvbmdpdHVkZSI6Ii02My4xMjQ5MCJ9">100 PRINCE ST, CHARLOTTETOWN</li></ul>
The HTML ID of each list item returned is a base64-encoded JSON object of all the information we need to display for that address; in this case, base64-decoding the ID returns:
{
  "street_no": "100",
  "street_nm": "PRINCE ST",
  "comm_nm": "CHARLOTTETOWN",
  "latitude": "46.23584",
  "longitude": "-63.12408",
  "dist_no": "12",
  "district": "Charlottetown - Victoria Park",
  "poll_no": "6",
  "candidate": "Karla Bernard",
  "url": "https://www.greenparty.pe.ca/karlabernard_d12",
  "photo": "smaller_karla_bernard.png",
  "advance": "Charlottetown Event Grounds",
  "advance_address": "360 GRAFTON ST, CHARLOTTETOWN",
  "advance_latitude": "46.24121",
  "advance_longitude": "-63.11709",
  "polling": "Central Christian Church",
  "polling_address": "223 KENT ST, CHARLOTTETOWN",
  "polling_latitude": "46.23809",
  "polling_longitude": "-63.12490"
}
(I base64-encode the object not for obfuscation nor network efficiency, but simply because it’s a handy way of moving the JSON back and forth packed inside a string; there are, I’m certain, much better ways of doing this).
When the voter clicks on one of the list items, the JSON gets used to display the information in a readable format.
You can see this all in operation in this short video clip (or you can try the tool out for yourself!):
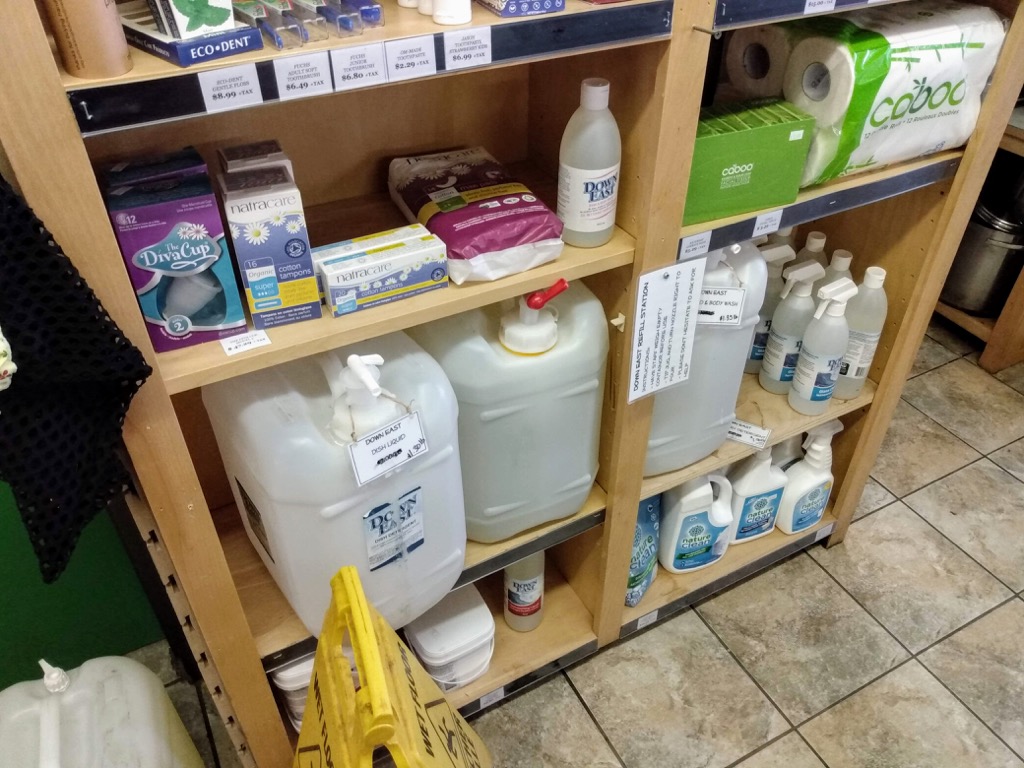
We were very happy to see, on a visit this afternoon, that Riverview Country Market is now selling Downeast soap products–laundry soap, dish soap, and hand & body wash–in bulk for filling your own container with.
We’ve been customers of Downeast products for a while, and it’s always seemed absurd to be recycling perfectly good containers–ones that will likely outlast us–every time we need new soap.
So we’ll be regular customers of Riverview’s new refilling station. Bravo!
I had the honour, after lunch at today’s PEI Home and School Federation Annual General Meeting, of posthumously awarding the late Shirley McGinn the Steve McQuaid Volunteer of the Year Award.
I was so happy to learn that the Prince Street Home and School had nominated Shirley for this award, and that the Federation’s board selected Shirley from those nominated to be recognized.
Here is the text of my remarks:
There are many reasons we give people awards.
When President Obama was awarded the Nobel Peace Prize in 2009, he had been on the job for less than a year, and the award was widely seen as an aspirational one: this is the kind of President we hope you will be.
Sometimes we give awards to people to thank them for their many years of service, to highlight a job especially well-done, or to encourage them to stick around and keep doing what they’re doing.
And sometimes, when we award someone posthumously, we’re saying look how this person lived: we all need to be more like that.
This is the case with the late Shirley McGinn, who we are recognizing today.
I met Shirley for the first time when we both volunteered as judges for the Heritage Fair at Prince Street School, when my son Oliver was a student there. To my surprise, Shirley not only knew who Oliver was, but appeared to have a pretty good understanding of him.
It was only later that I learned that Shirley was a regular volunteer at the school, and had been, for several years already, part of Oliver’s school life.
And later still I learned that when Shirley retired from a long career as a public school teacher, finishing at Parkdale, she started volunteering at Prince Street the very next day.
Shirley had the gift of being able to remember people, and, after our first meeting at the Heritage Fair, every time I ran into her she called me by name, and asked after Oliver.
It didn’t surprise me when, last spring on a visit to the Queen Elizabeth Hospital information desk, it was Shirley I found there, at one of her other volunteer jobs, one she held for 23 years.
There are people who volunteer in Island schools whose acts of service and dedication improve the lives of students, teachers, and all who come into contact with them: Shirley McGinn was one such person.
Even after retiring as a school teacher, she knew that there was more that she could be doing to support students: she volunteered at Prince Street School for more than 15 years, right up until her death last December.
Students always looked forward to spending time with Shirley, and she worked with them in many ways:
- She provided students with needing one-on-one time with a caring adult; she greeted everyone with a warm, welcoming smile; she believed in the value of conversation, social time, and the importance of having fun.
- She enjoyed playing engaging games with students to make learning fun, as well as keeping students interested in learning.
- She gave students a chance to have a voice, engaged them in conversation, as well as lending them a caring ear.
- She helped students to improve their reading, writing, and math skills through her patience and strong commitment. She would come every morning to help tutor students who needed extra help.
- She was dedicated to supporting the breakfast program: before tutoring students, she would come in early to prepare breakfast for 60 to 90 students. She believed that a smile and some nutritious food would help their learning for the day.
Home and School is an organization driven by dedicated volunteers, interested in strengthening the bond between home and school, to better the education of our children.
Shirley accomplished this with her personality, and willingness to serve, and she will always be part of the family that she helped create at Prince Street, and in the Island community at large.
Shirley was a school teacher with a distinguished career, and after retirement chose Prince Street Elementary School as the place where she could continue to touch the lives of students, staff and families. She made a difference in students’ lives: because of her, they learned more, and developed a greater sense of belonging.
The Prince Street School community is convinced that no one could be more deserving of this award.
Shirley’s brother Brendon McGinn accepted the award on Shirley’s behalf; there were not many dry eyes in the house when he did.
Look how this person lived: we all need to be more like that.
About This Blog
 I am Peter Rukavina and this is my blog. I am a writer, letterpress printer, and a curious person.
To learn more about me, read my /now, look at my bio, listen to audio I’ve posted, read presentations and speeches I’ve written, see things I’ve favourited elsewhere, or get in touch (peter@rukavina.net is the quickest way).
I have been writing here since May 1999: you can explore the 25+ years of blog posts in the archive.
![]() You can subscribe to an RSS feed of posts, an RSS feed of comments, an RSS feed of favourites elsewhere, or a podcast RSS feed that just contains audio posts. You can also receive a daily digests of posts by email. I also publish an OPML blogroll.
You can subscribe to an RSS feed of posts, an RSS feed of comments, an RSS feed of favourites elsewhere, or a podcast RSS feed that just contains audio posts. You can also receive a daily digests of posts by email. I also publish an OPML blogroll.
Instagram • YouTube • Vimeo • ORCID • OpenStreetMap • Internet Archive • PEI.art • Drupal • Github.