When I agreed to make up the tickets for this year’s Kindred Spirits Quilt Guild raffle, I bit off a little more than my time would allow to print on the letterpress (they need 1,500 tickets, perforated; not beyond my capacity, but a big job). So I reverted to my previous career as a graphic designer and produced a PDF for someone else to print, in this case Kwik Kopy, which did a nice job. Buy your tickets starting next week from Kindred Spirits members!

I wonder how often this presents a practical impediment.

I’ve spent the week experimenting with The Things Gateway and The Things Uno, with hopes that we might deploy them as the basis of a low-cost sensor network in Charlottetown. I’ve written about this on The Things Network website.
My friend Catherine Hennessey has called me twice in the past week, claiming to have heard me talking about rabbits on CBC Radio.
It turns out that, in celebration of its 400th episode, CBC’s Spark took a look back at the weird and wonderful it’s covered over the last 11 years. And I qualified, by way of the piece I recorded with host Nora Young about my Nabaztag rabbit back in 2007.
Nora’s such a great interviewer: she’s naturally curious and she made it easy to talk to her on the radio about a weird little magic French digital rabbit.
Mystery solved.
There are a lot of reasons to take on a job: love, money, fame, power.
Today’s job, however, I took on almost entirely because it afforded me the opportunity to see inside the bell tower of Charlottetown City Hall.
When I say “job,” in this case, I mean “another wild unpaid pursuit,” and, in this case, that means setting the city up with a LoRaWAN network to allow citizens to contribute all manner of sensor data via a central, managed gateway.
I’m experimenting with gear from The Things Network, an ambitious Dutch effort to build simple low-cost LoRaWAN hardware and supporting server infrastructure: the idea is that you stick one or two gateways high up somewhere in central locations in a city, and each is able to drink in data from thousands of sensors located within range.
The bell tower at City Hall is not the tallest place in Charlottetown, but it is somewhat high, and does have the benefit of being publicly-owned with sustainability-minded people at the helm. So it’s a prime candidate.
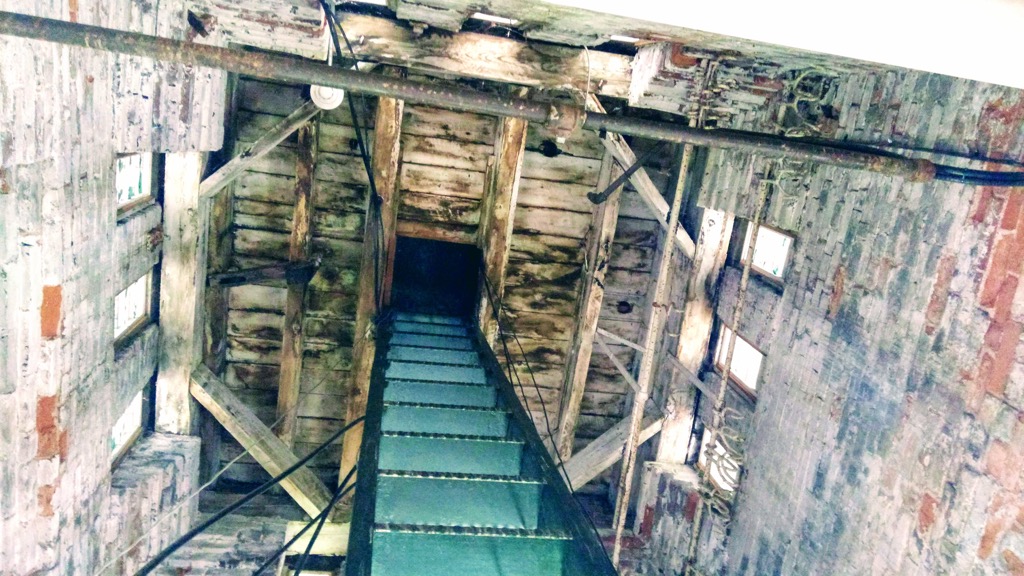
The original plan was to do a test of the LoRaWAN gateway’s range from the very top of the bell tower, but once that idea saw the cold light of day, notions like “have you had fall-protection training?” came into play, and we down-scaled to do the testing from the top floor of City Hall instead, at least for now. But given that the bell tower door was right beside us, I was offered a look up. And seeing the ladder that leads upward, and then, worse, looking down, I realized that this was all for the best. If City Hall turns out to be a good location, then we’ll get a trained climber-of-high-things to mount the gateway high up.
As it happens, the test never got to happen: it turns out that The Things Gateway needs to have outbound access on a variety of ports to send its messages up to the MQTT server on the other end, and those ports are currently firewalled on City Hall’s guest wifi. So a request for firewall updates has been submitted, and we will bide our time.
But I did get to see the bell tower, and that was neato.
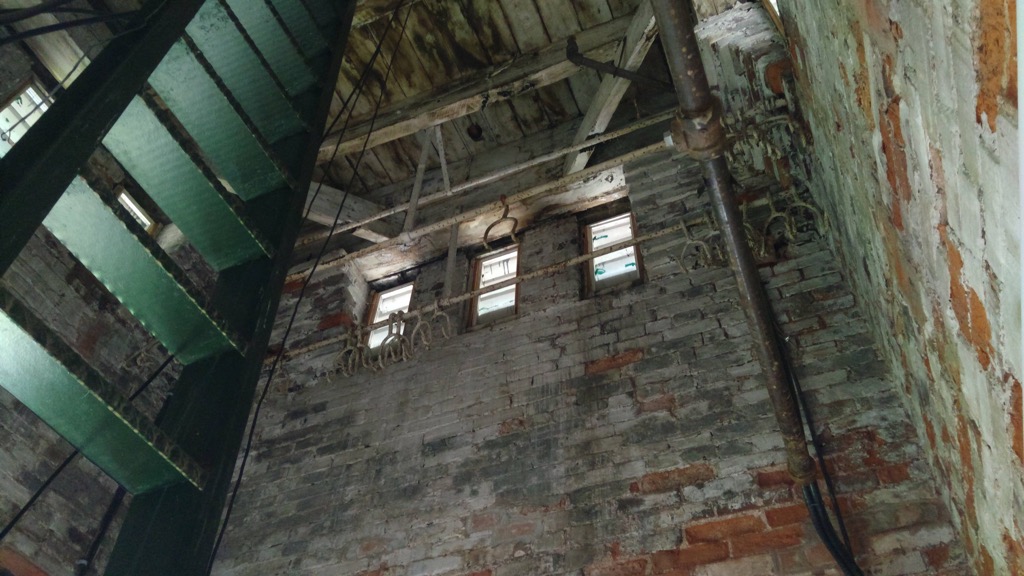
Among the highlights, was spotting what I have to assume are the hooks around which firehoses of yore were hung to dry (my initial assumption was that this is where City Hall would hang its beef to age, but that seemed implausible):
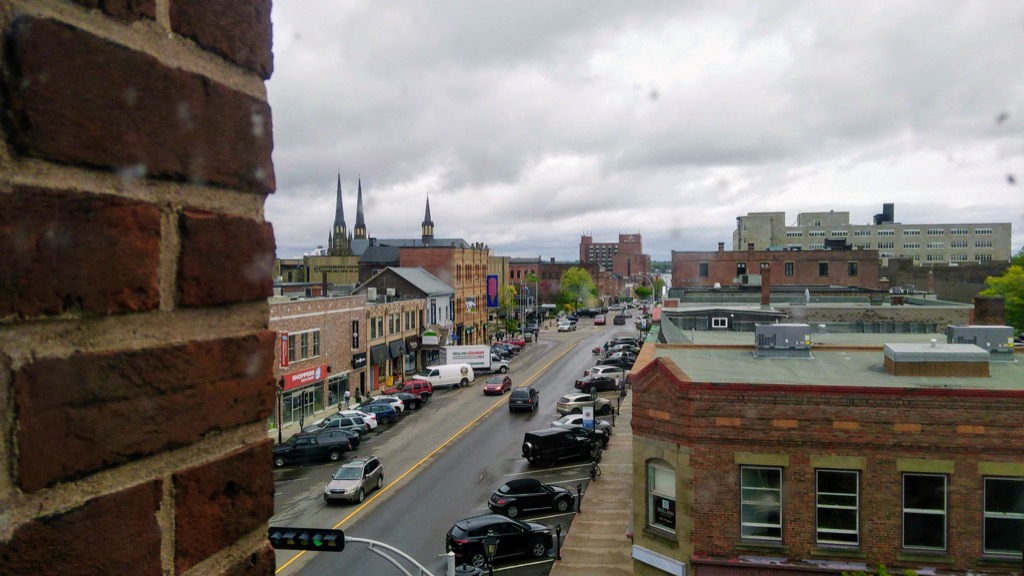
There’s also a very nice view down Queen Street from the windows at the bottom of the tower:
Stay tuned for the next chapter in this exciting saga.
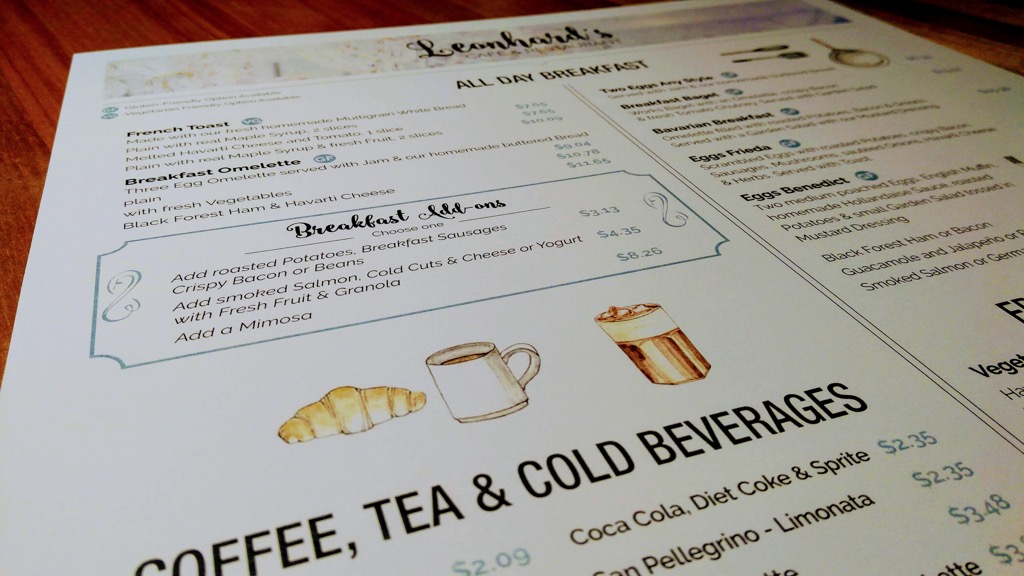
After a few years of forgetting to go to Leonhard’s, a café just up the corner and around the bend from our house, I’ve started dropping in again, from time to time. As I did today. Where I encountered their lovely new menu, a menu so lovely that it changes the entire character of the place. Watercolour illustrations are by the talented Bayside by Sam.
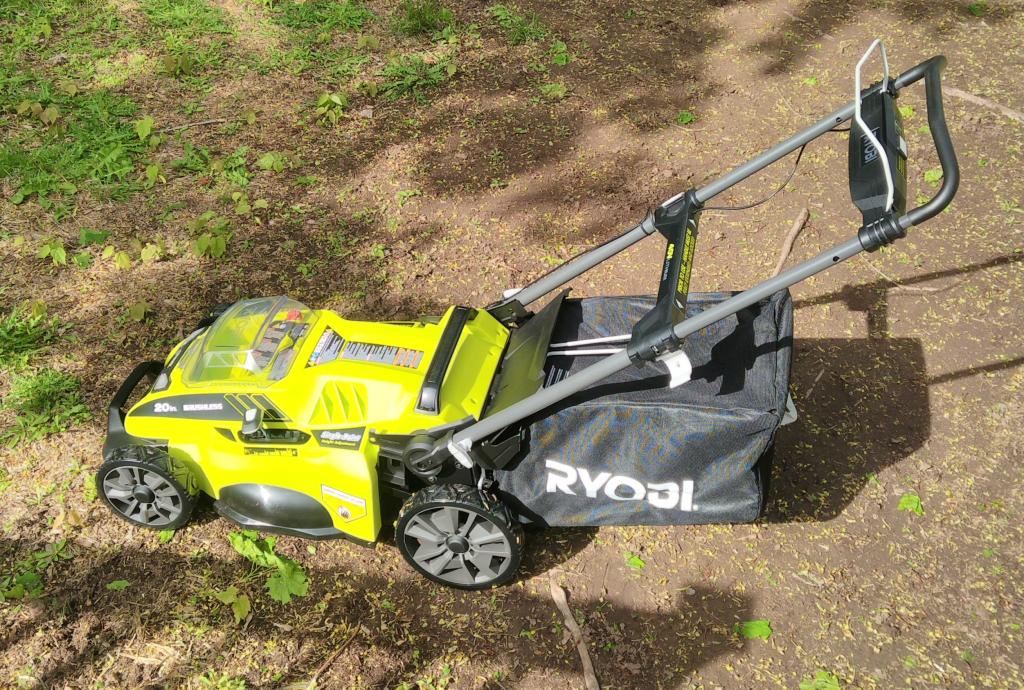
After a lifetime of combative relationships with gasoline-powered lawnmowers (and, by times, those that would force me to use them), I cannot do sufficient justice to the joy I have found in this cordless electric one.
At $368 from Home Depot, it’s in the same price range as its belching cousins. But it needs neither gas nor oil (nor some alchemical combination of the two; I’m looking at you Lawnboy), and starting it is a simple push of a button rather than an arm-wrenching pull of a rope.
Our lawn is mowed. The Ryobi 40180 is folded up in the mudroom, ready for its next call-out. I am happy. Who would have ever thought.
Google Maps for Android has a feature that has been alternatively referred to as “Latitude” “Location History” and “Timeline” that allows me to drop a constant stream of digital breadcrumbs marking my location and to then explore that on a map.
I’ve been dropping these breadcrumbs, off and on, for 8 years, so I have a lot of data accumulated: 1.3 million breadcrumbs in total, from January 15, 2010 until today.
Visiting Google’s “Your Timeline” page in a desktop browser allows for some basic visualization and analytics for this data; here’s what my vagabonding looks like:
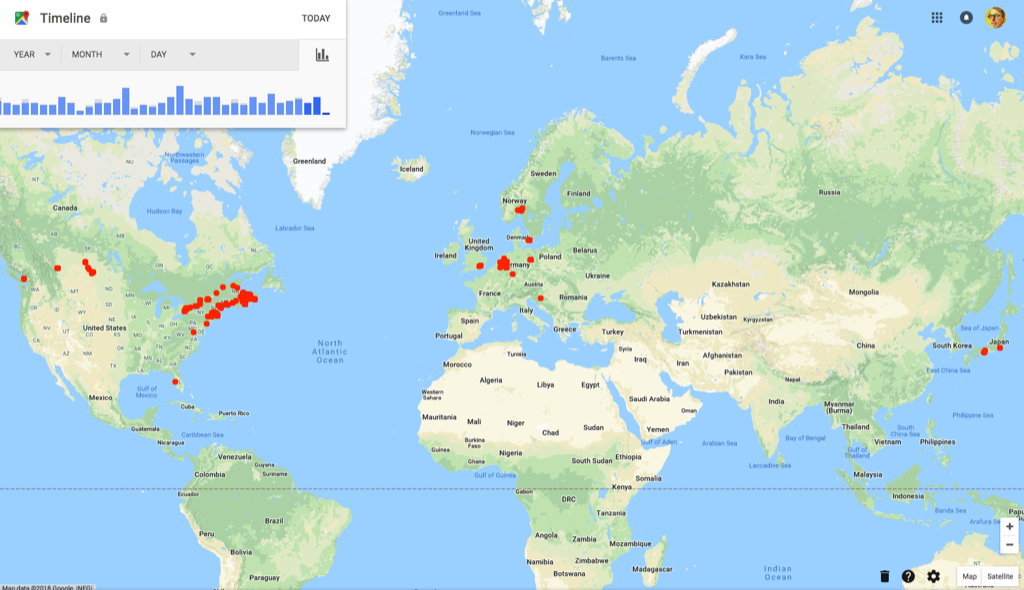
This is an incomplete picture of my travels because I haven’t always had an Google Maps-capable phone in my pocket and, even when I have, I haven’t always had a data plan that would allow me to gather the data. This is why you don’t see any markers in Ukraine, for example: I was carrying an old Nokia N95 on my trip there in 2012.
Google Maps also attempts to auto-correlate my travels to points of interest where I’ve stopped along the way. It’s recorded 887 of these over the years, and the same high-level overview reports on the top 10 places I’ve visited:
- 100 Prince Street (my house)
- The Guild (my office for 7 years)
- Charlottetown Farmer’s Market
- Colonel Gray Senior High School
- Mad Wok
- Sobeys
- Receiver Coffee
- Casa Mia Café
- Birchwood Intermediate School
- Queen Elizabeth Hospital
That’s my life pretty well in a nutshell.
Google’s “takeout” service allows me to export all 1.3 million geolocations into a JSON file that I can then use outside of Google Maps. And, indeed, there’s more than just geolocations in the file, as Google Maps is not only tracking nodes on the graph of my life, but edges too. For example, here’s a slice of my Friday:
{
  "locations" : [ {
    "timestampMs" : "1527896063946",
    "latitudeE7" : 462356055,
    "longitudeE7" : -631246024,
    "accuracy" : 16,
    "altitude" : -15,
    "verticalAccuracy" : 2
  }, {
    "timestampMs" : "1527896058549",
    "latitudeE7" : 462357912,
    "longitudeE7" : -631240912,
    "accuracy" : 17,
    "altitude" : -17,
    "verticalAccuracy" : 3
  }, {
    "timestampMs" : "1527895978334",
    "latitudeE7" : 462357912,
    "longitudeE7" : -631240912,
    "accuracy" : 17,
    "altitude" : -17,
    "verticalAccuracy" : 3
  }, {
    "timestampMs" : "1527895916802",
    "latitudeE7" : 462357912,
    "longitudeE7" : -631240912,
    "accuracy" : 17,
    "altitude" : -17,
    "verticalAccuracy" : 3,
    "activity" : [ {
      "timestampMs" : "1527895917135",
      "activity" : [ {
        "type" : "STILL",
        "confidence" : 100
      } ]
    } ]
  }
}
The timestamps are in milliseconds, can can be converted into human readable dates with converters like this one, which tells me that that timestamps in this slice are:
- Fri Jun 01 2018 20:34:23
- Fri Jun 01 2018 20:34:18
- Fri Jun 01 2018 20:32:58
- Fri Jun 01 2018 20:31:56
From these timestamps, Google deduced that I was “STILL” during this period. Which, indeed, I was, as I was sitting here at my office desk typing away.
Other data points are more exciting, like this one from Friday afternoon:
{
	"timestampMs": "1527874663966",
	"latitudeE7": 462356055,
	"longitudeE7": -631246024,
	"accuracy": 16,
	"altitude": -15,
	"verticalAccuracy": 2,
	"activity": [{
			"timestampMs": "1527874645435",
			"activity": [{
				"type": "TILTING",
				"confidence": 100
			}]
		},
		{
			"timestampMs": "1527874659795",
			"activity": [{
				"type": "ON_FOOT",
				"confidence": 31
			}, {
				"type": "UNKNOWN",
				"confidence": 31
			}, {
				"type": "WALKING",
				"confidence": 31
			}, {
				"type": "IN_VEHICLE",
				"confidence": 8
			}, {
				"type": "ON_BICYCLE",
				"confidence": 8
			}, {
				"type": "STILL",
				"confidence": 8
			}, {
				"type": "RUNNING",
				"confidence": 8
			}, {
				"type": "IN_ROAD_VEHICLE",
				"confidence": 8
			}, {
				"type": "IN_RAIL_VEHICLE",
				"confidence": 8
			}, {
				"type": "UNKNOWN",
				"confidence": 4
			}, {
				"type": "UNKNOWN",
				"confidence": 4
			}]
		}
	]
}
This tells me that on Friday afternoon at 2:37 p.m., Google Maps deduces with 100% confidence that I was “TILTING” (I haven’t been able to find a definition for this, but it might mean my phone was in my hand, tilted) at location 46.2356055, -63.1246024, and that I was, with 31% confidence, engaged in a foot, walking, and/or unknown activity at the time. Looking at the Google Maps rendering of my Friday afternoon, it looks like this was the return to work from coffee with a friend at Leonhard’s and the removal from my bag of my phone to plug it in.
Moving from the detailed to the broad overview, there’s a handy open source tool called location-history-visualizer that allows a higher level exploration of the complete data set: operating entirely in the browser, it accepts the Google Takeout JSON file of location history, post-processes it, and then visualizes it on a map at any scale. I had a lot of fun exploring this map, and grabbed several screen shots showing the heatmap of my life at different levels.
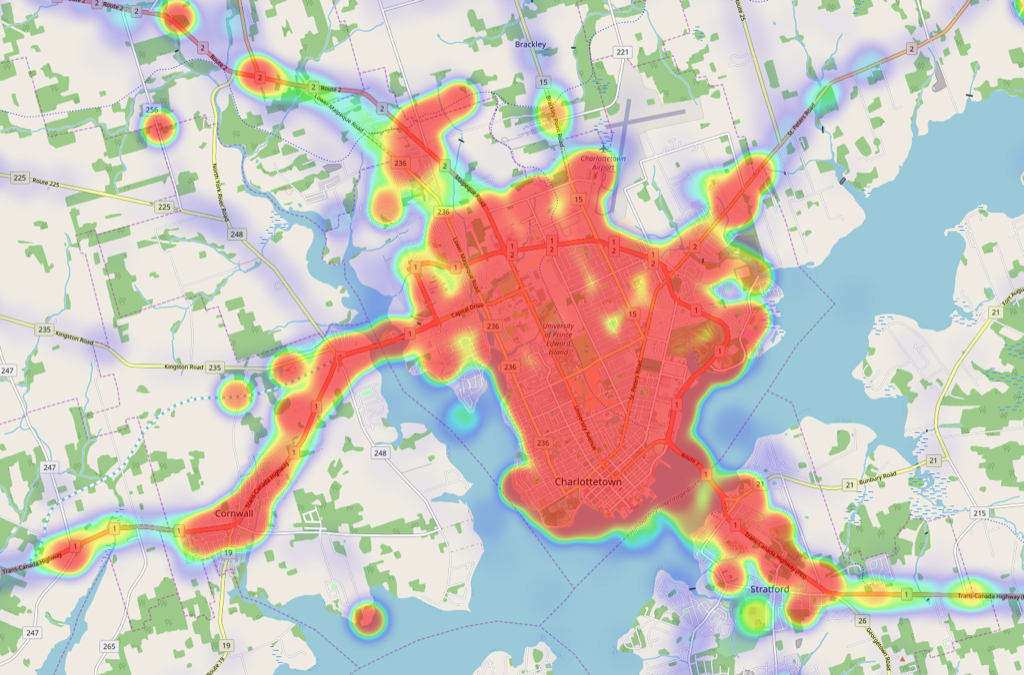
Here’s Charlottetown, to start with. This heat map shows 8 years of my rambles around the city:
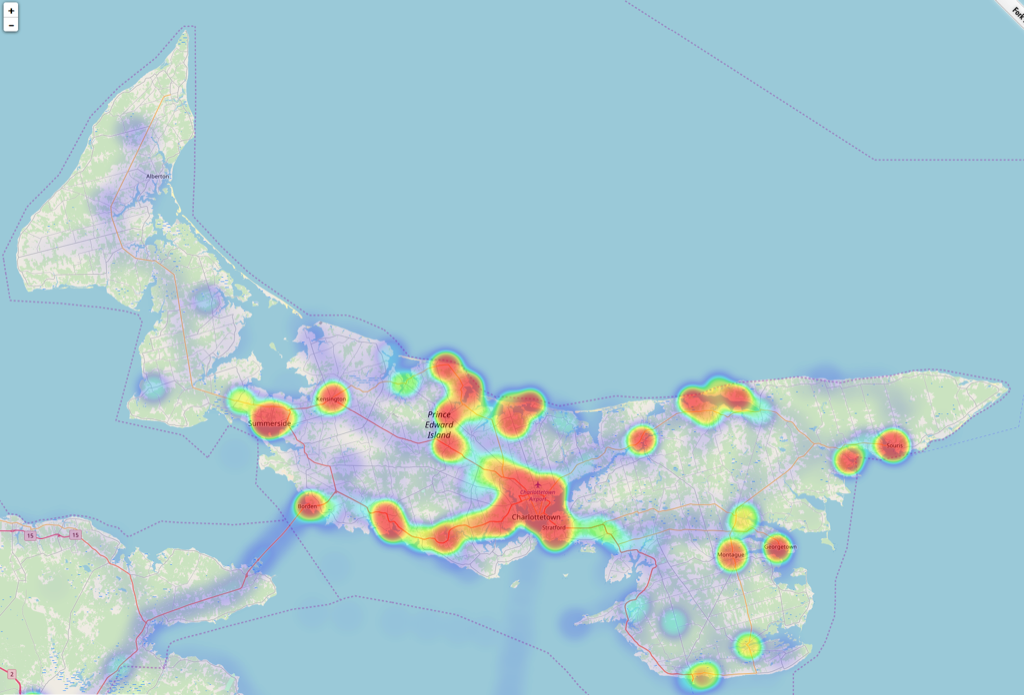
Moving outward, here’s Prince Edward Island over the same period:
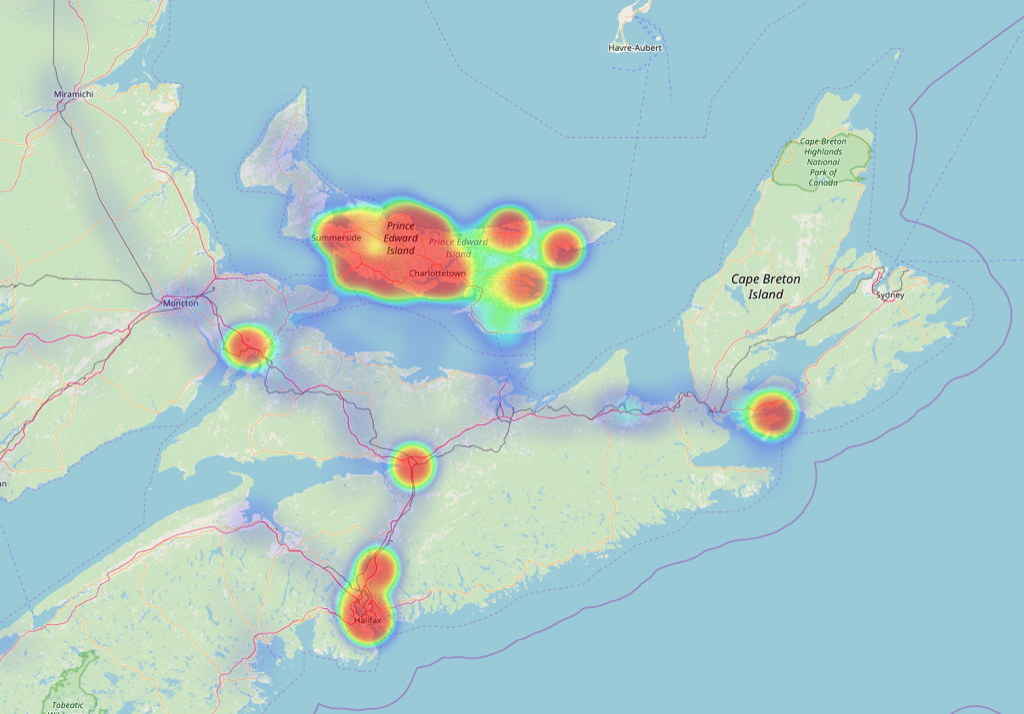
Outward from PEI to Atlantic Canada:
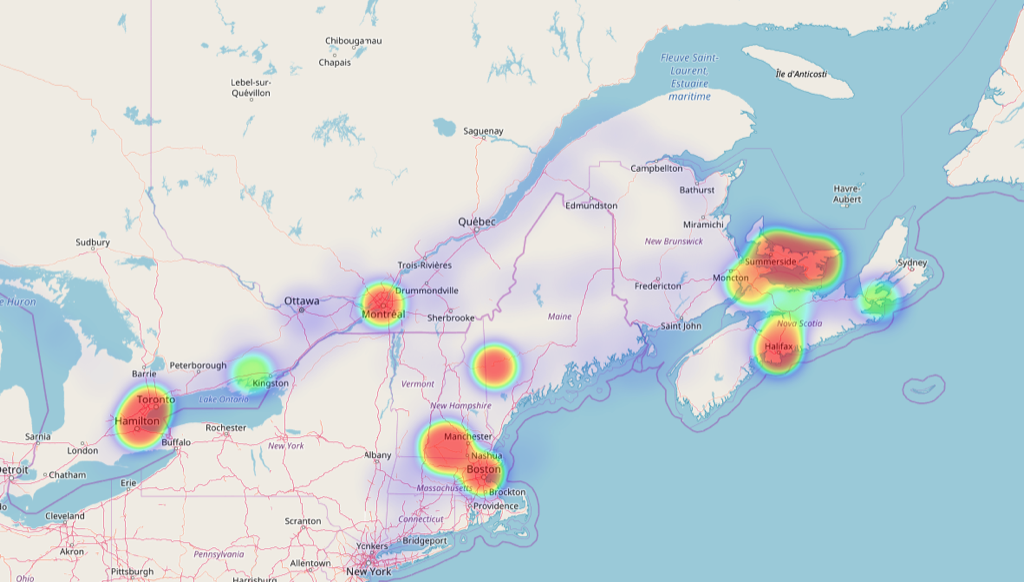
Here’s eastern North America, which shows my frequent travels to Boston and southern New Hampshire, to family in Montreal and Ontario and Napanee, as well as a week spent in a cottage in Maine:
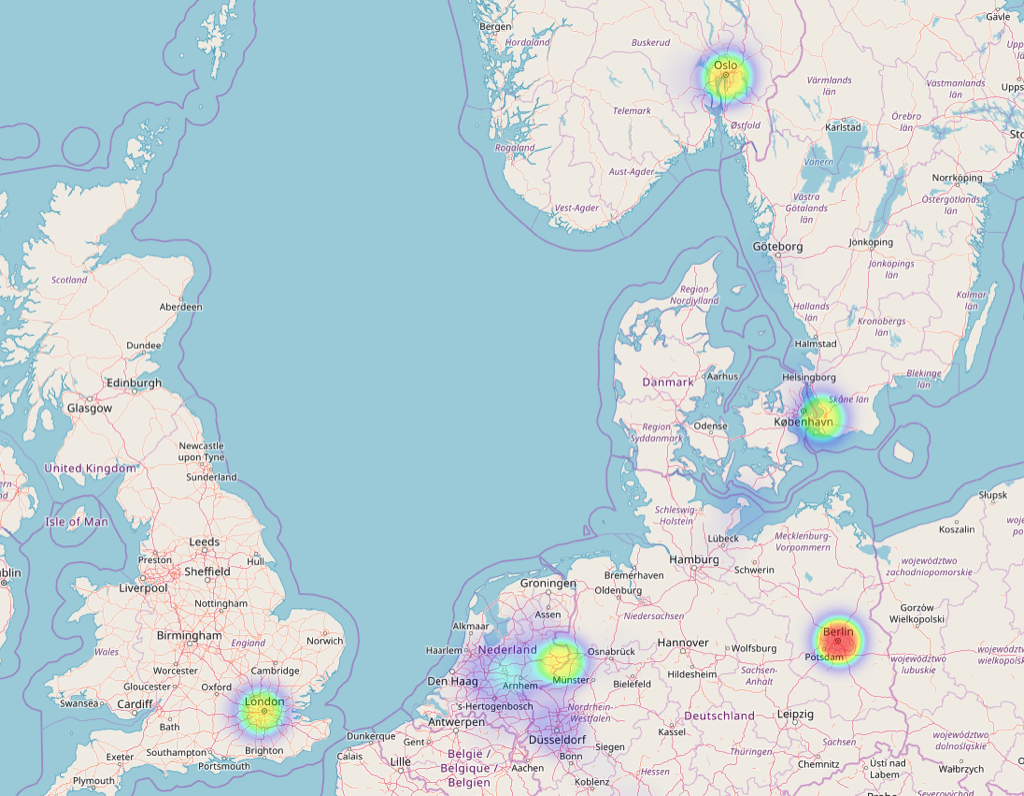
My European travels are not well-represented in the data, both because a lot that travel happened pre-2010, and because I didn’t always have data coverage on my more recent trips:
Finally, a global view, a view that, like Google’s own, shows clearly that my travels haven’t taken out out a 25 degree band of latitudes running from 35ºN (Tokyo) to 60ºN (Oslo). I’ve not been anywhere near south of the equator, nor anywhere east between Croatia and Japan:

Truth be told, I have been further south (to Florida, 28ºN) and further east (to Kiev, 30ºE), but didn’t drop digital breadcrumbs there.
Squirreled away on my computer I have a richer collection of geolocation data gathered from other sources–Flickr, Foursquare, Here, Plazes and Twitter–running from 2004 to the present. I’ve long thought it would be an interesting project to come of with a way to convert all of that data into a common format to allow me to view it in aggregate; this incomplete slice of my heatmap through Google’s eyes might be the inspiration I need to finally do that.
From an interview with Nell Bang-Jensen, theatre artist and sometime PEI summer resident:
That our capitalist society places so little value on the work of literally keeping people alive is fascinating (and utterly depressing) to me.
From an interview with visual artist Pedro Reyes:
The blame always goes to whoever pulls the trigger, but we have to look at the systemic framework, like the economy of fear. Crime and the war on drugs is good business for the weapon industry. It’s a kind of manifestation of disaster capitalism.
 I am
I am