
Every Saturday afternoon, en route to Crapaud, Oliver and I have lunch at A&W followed by a drink at Starbucks.
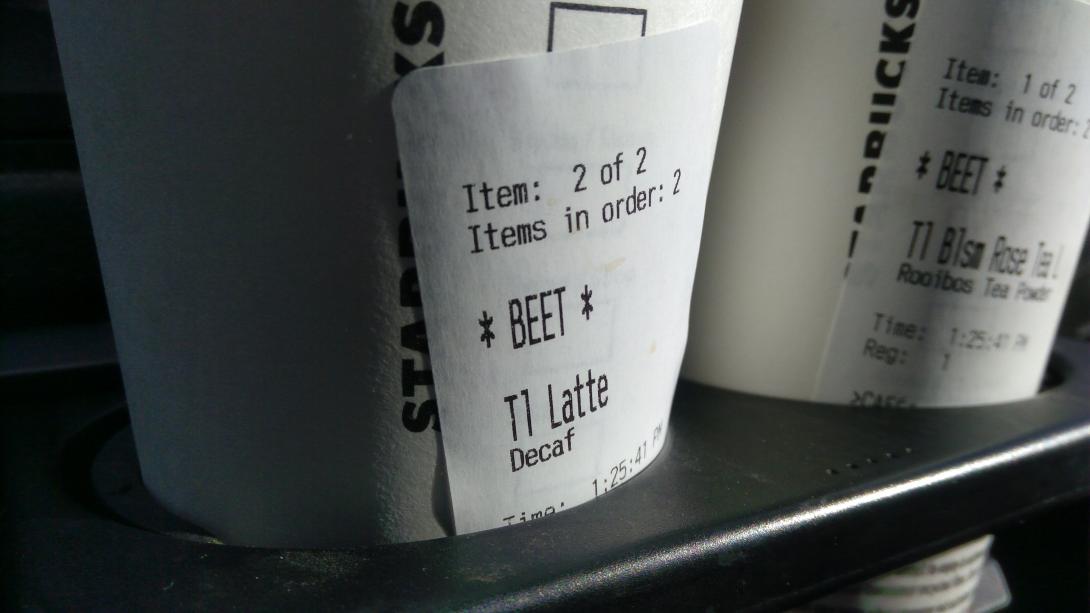
The drive-thru line at Starbucks today was really long, so we opted to go inside to order, and I was asked for my name by the order-taker.
“Pete,” I told her, using the pseudonym I fall back on for such purposes.
Seeing through my charade—he’s obviously not a Pete, she realized—my cup was labeled BEET.
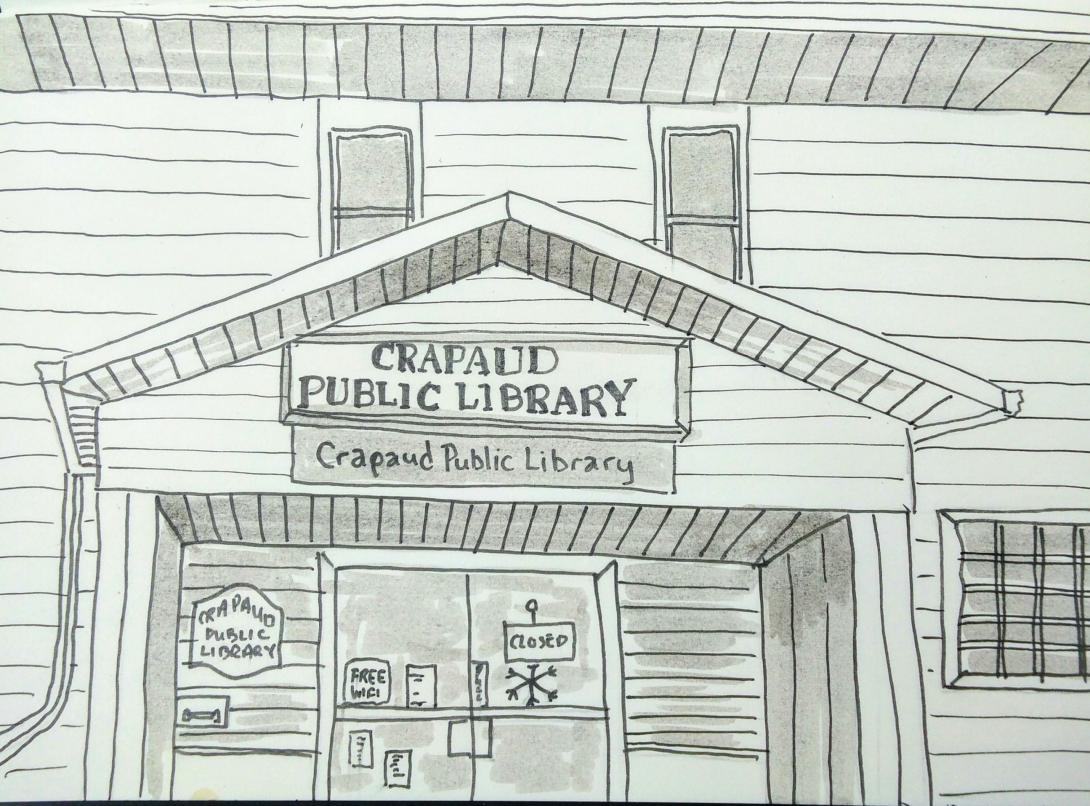
I was hopeful that I would be able to tap into the free wifi at the Crapaud Public Library this afternoon to watch the speeches at the PC leadership convention.
But the library was closed, the wifi locked down, and I was out of luck (why all Islanders don’t simply have automatic wifi access at all Island libraries, without bureaucratic rigmarole, I do not understand).
My consolation prize was the opportunity to sketch the library entrance from my position in the driver’s seat of my (increasingly freezing cold) Jetta.
Today seems like an opportune time to resurface the email I got from Jeff Bezos in 1995 after I sent a suggestion to Amazon customer support. Back then he and I were both mere mortals; I still am.
The blog of the Architect of the Capitol in Washington, DC is an interesting new find for me; I found today’s post, Cast in a New Light: The Capitol Bronze Shop particularly interesting:
Additional workers hired for the Capitol Bronze Shop included founders, chasers, bronze filers, finishers and laborers. They initially cast ornamentation and small works of art and later produced more practical fixtures such as hat hooks, hinges, heat registers and keys.
If the maintenance and restoration of national capital infrastructure is your jam, you may also be interested in the ongoing work to rehabilitate Centre Block in Ottawa.
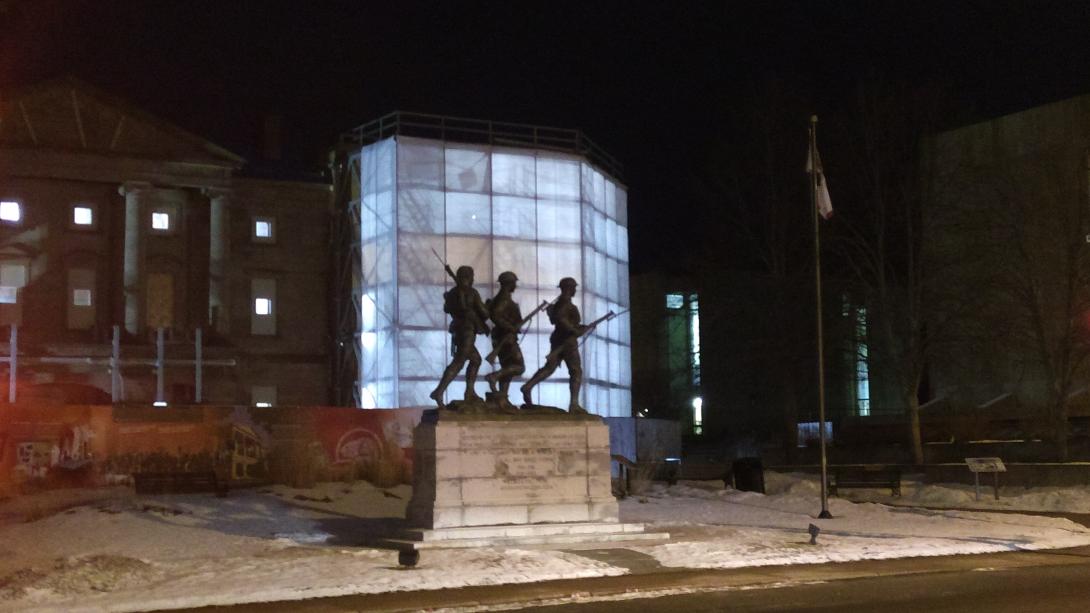
The shrouded exoskeleton around the western end of Province House was lit up last night like a large scale art installation. Tetris!
With the talk about the scourge of bottled water this week, let’s not forget that people like Leo Broderick and Mary Boyd have been calling for its elimination for years.
The Pendergast family has been an important presence in our life on Prince Edward Island: they are an enormously talented bunch, whether concerning matters of food, books, music or philosophy. And among the kindest lot you’ll ever encounter.
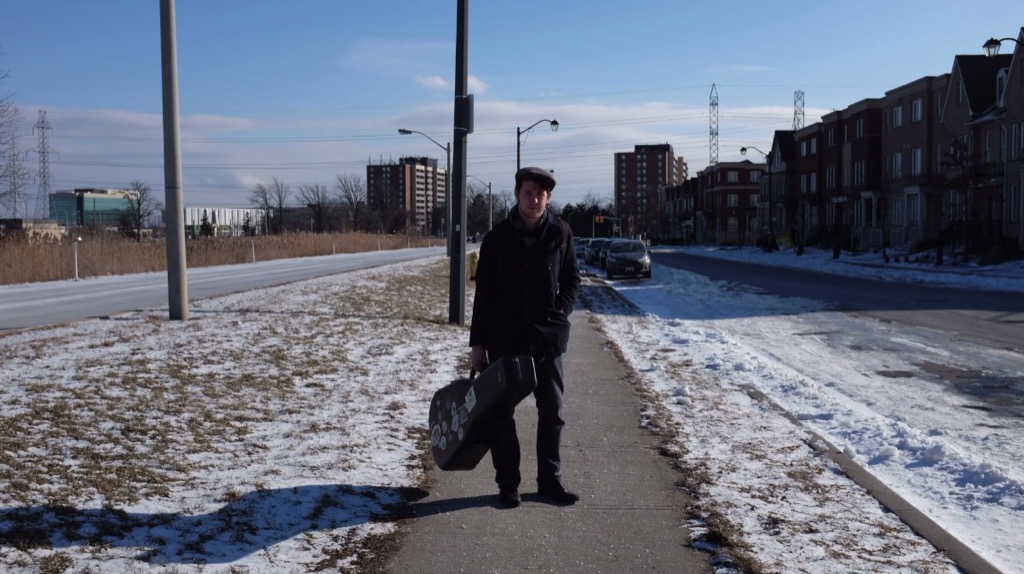
The talent has made it to the next generation: young Shane Pendergast–you may remember him from the film he made about John Bil–is an entrant in the CBC Searchlight competition, and you can vote for him right now as easily as clicking right here, listening to his track (you don’t have to listen to it to vote, but it’s a good track, and you should), and clicking Vote.
You can do this, apparently, up to once a day.
While other students were busy writing exams, Oliver spent the week meeting with all manner of people about what comes next for him.
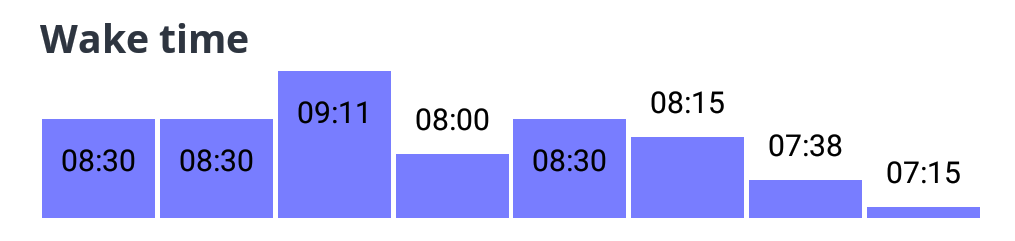
While we had a busy schedule running around town, we could all sleep in a little later than usual. But school started back up today (Oliver’s last semester of public school!), and so I woke up, as usual, once Stephanie Kelly read the CBC news headlines. The home stretch!
The next time you’re getting an x-ray done at the Queen Elizabeth Hospital (or perhaps heading to day surgery or physiotherapy) be on the lookout for this photo by Hon. Gilbert Clements in the hallway.
While you’re at it, look out for tapestries by William Kurelek and Harold Town along the same stretch.

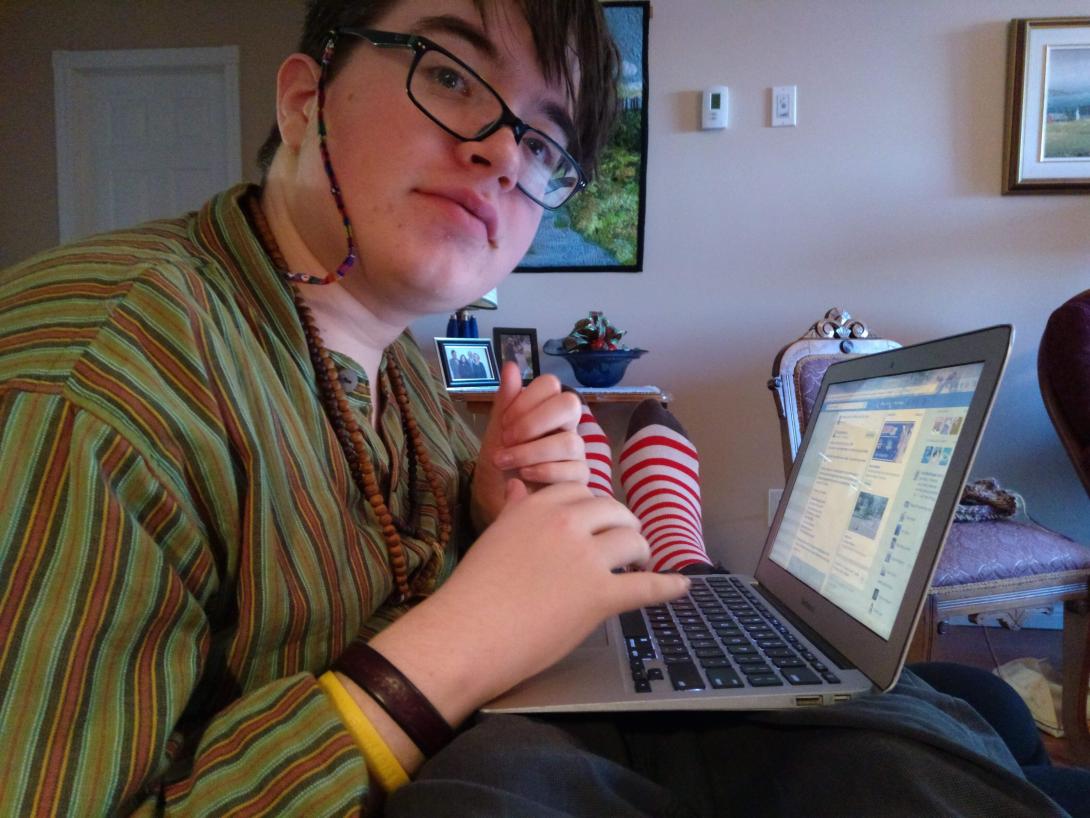
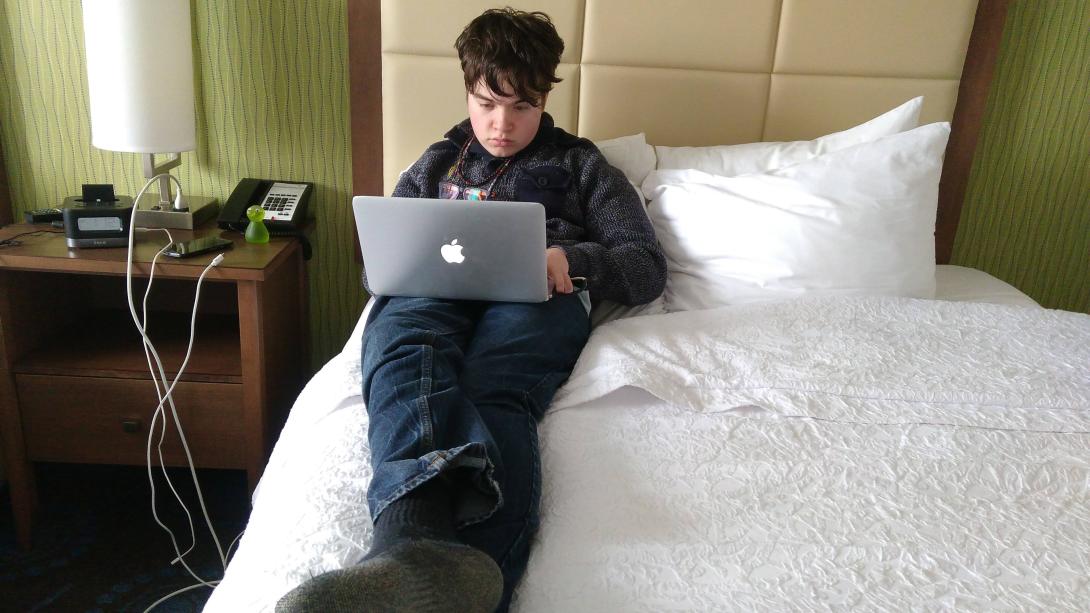
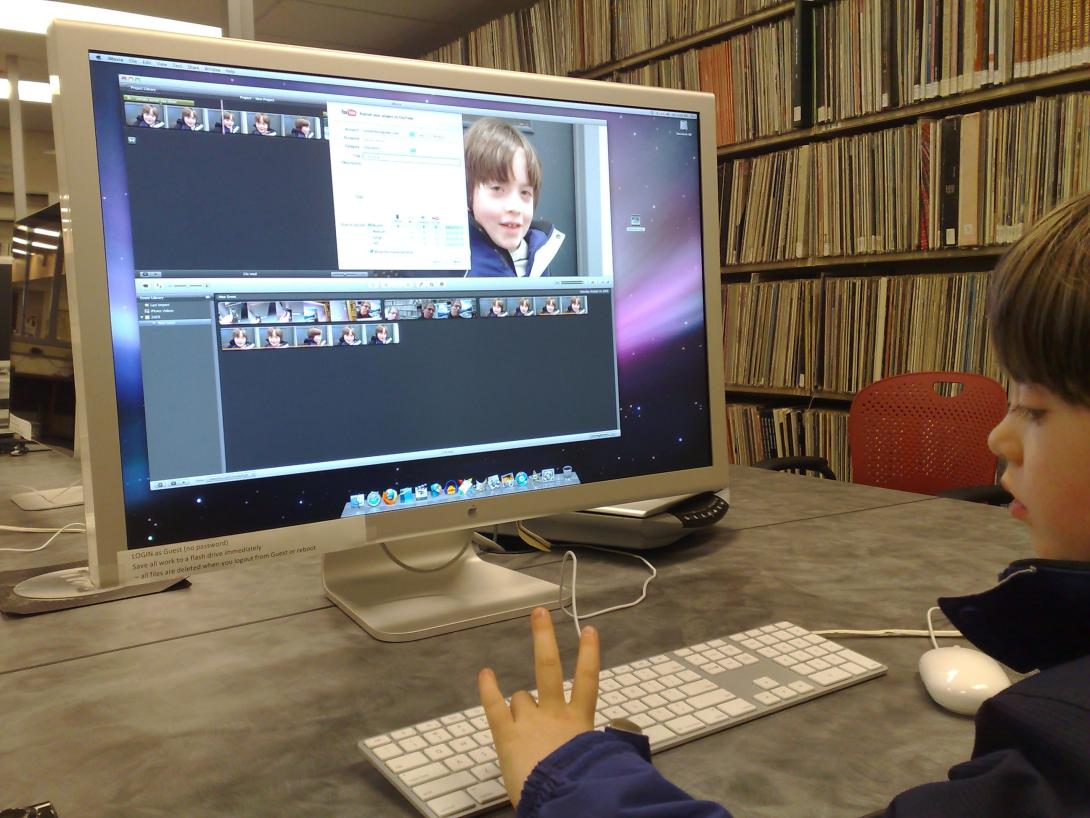
Oliver reviews the last 10 years to mark a decade of his blog.
I can’t wait to see what the next 10 years hold for him.
 ,
,  ,
,  ,
, 
About This Blog
 I am Peter Rukavina and this is my blog. I am a writer, letterpress printer, and a curious person.
To learn more about me, read my /now, look at my bio, listen to audio I’ve posted, read presentations and speeches I’ve written, see things I’ve favourited elsewhere, or get in touch (peter@rukavina.net is the quickest way).
I have been writing here since May 1999: you can explore the 25+ years of blog posts in the archive.
![]() You can subscribe to an RSS feed of posts, an RSS feed of comments, an RSS feed of favourites elsewhere, or a podcast RSS feed that just contains audio posts. You can also receive a daily digests of posts by email. I also publish an OPML blogroll.
You can subscribe to an RSS feed of posts, an RSS feed of comments, an RSS feed of favourites elsewhere, or a podcast RSS feed that just contains audio posts. You can also receive a daily digests of posts by email. I also publish an OPML blogroll.
Instagram • YouTube • Vimeo • ORCID • OpenStreetMap • Internet Archive • PEI.art • Drupal • Github.