
Earlier today I mused about linking to myself:
Discovering that I refer back to earlier posts as often as I do makes me wish I had a way of visualizing the interconnections between my posts; now that I have the building blocks for this, I’ll see what I can do about this.
Then I remembered that I did some graph visualizing work 10 years ago, as part of the OpenCorporations.org project, that allow inter-corporate of Prince Edward Island corporations to be visualized by generating DOT language files.
So I did the same thing for the 8,110 blog posts I’ve written here since 1999.
I wrote a script to go through each post and extract the links from one ruk.ca post to another ruk.ca post: there were 1201 of them in total.
As a byproduct of the counting, I found the most popular posts (measured by how often I link to them):
- Welcome to The Reinventorium (12 links)
- Adana Eight Five (10 links)
- Akzidenz Grotesk (10 links)
- How to Levee (9 links)
- The Golding Jobber No. 8: It’s Alive! (7 links)
I then wrote this to a DOT file, and then visualized the DOT file in OmniGraffle, and the result looks like this in the “radial” rendering:
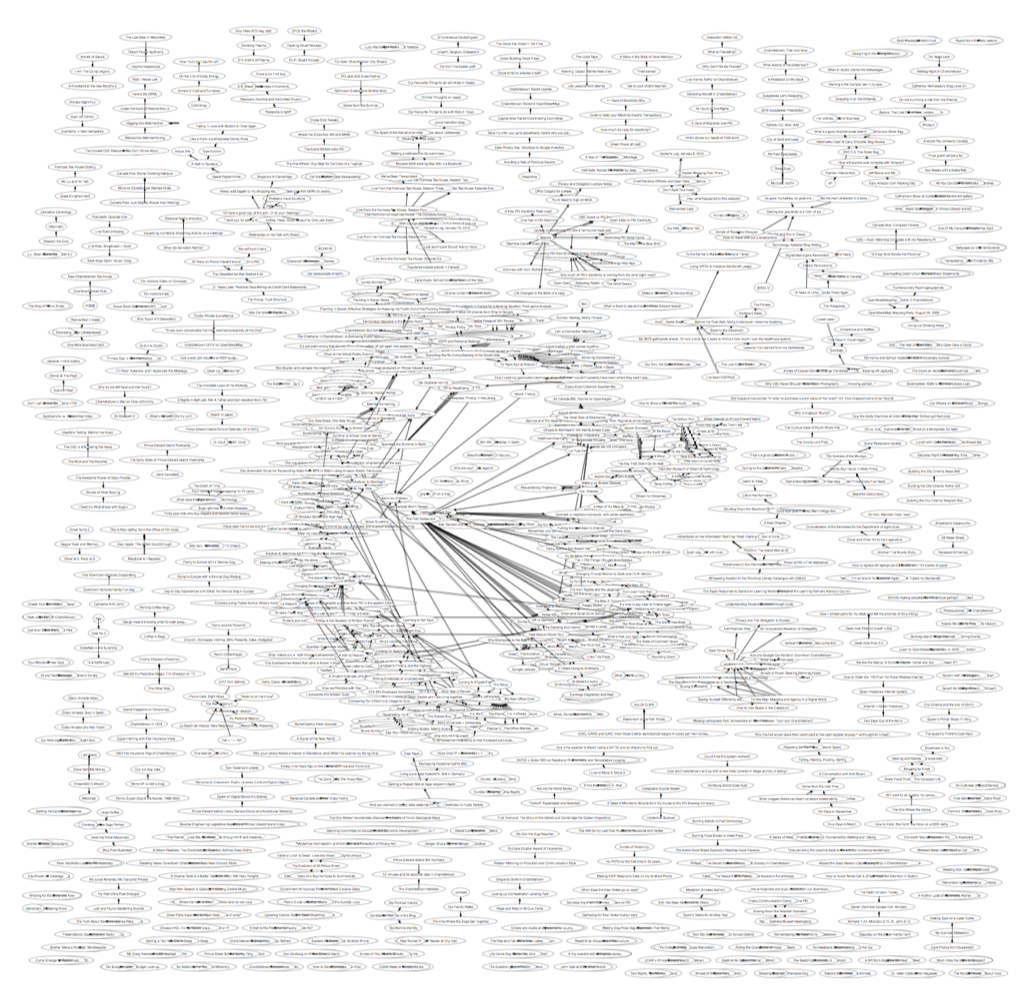
It’s hard to do justice to just a dense array of interconnections in such a small space as this, but you can get a sense of the nature of the forest even at this level.
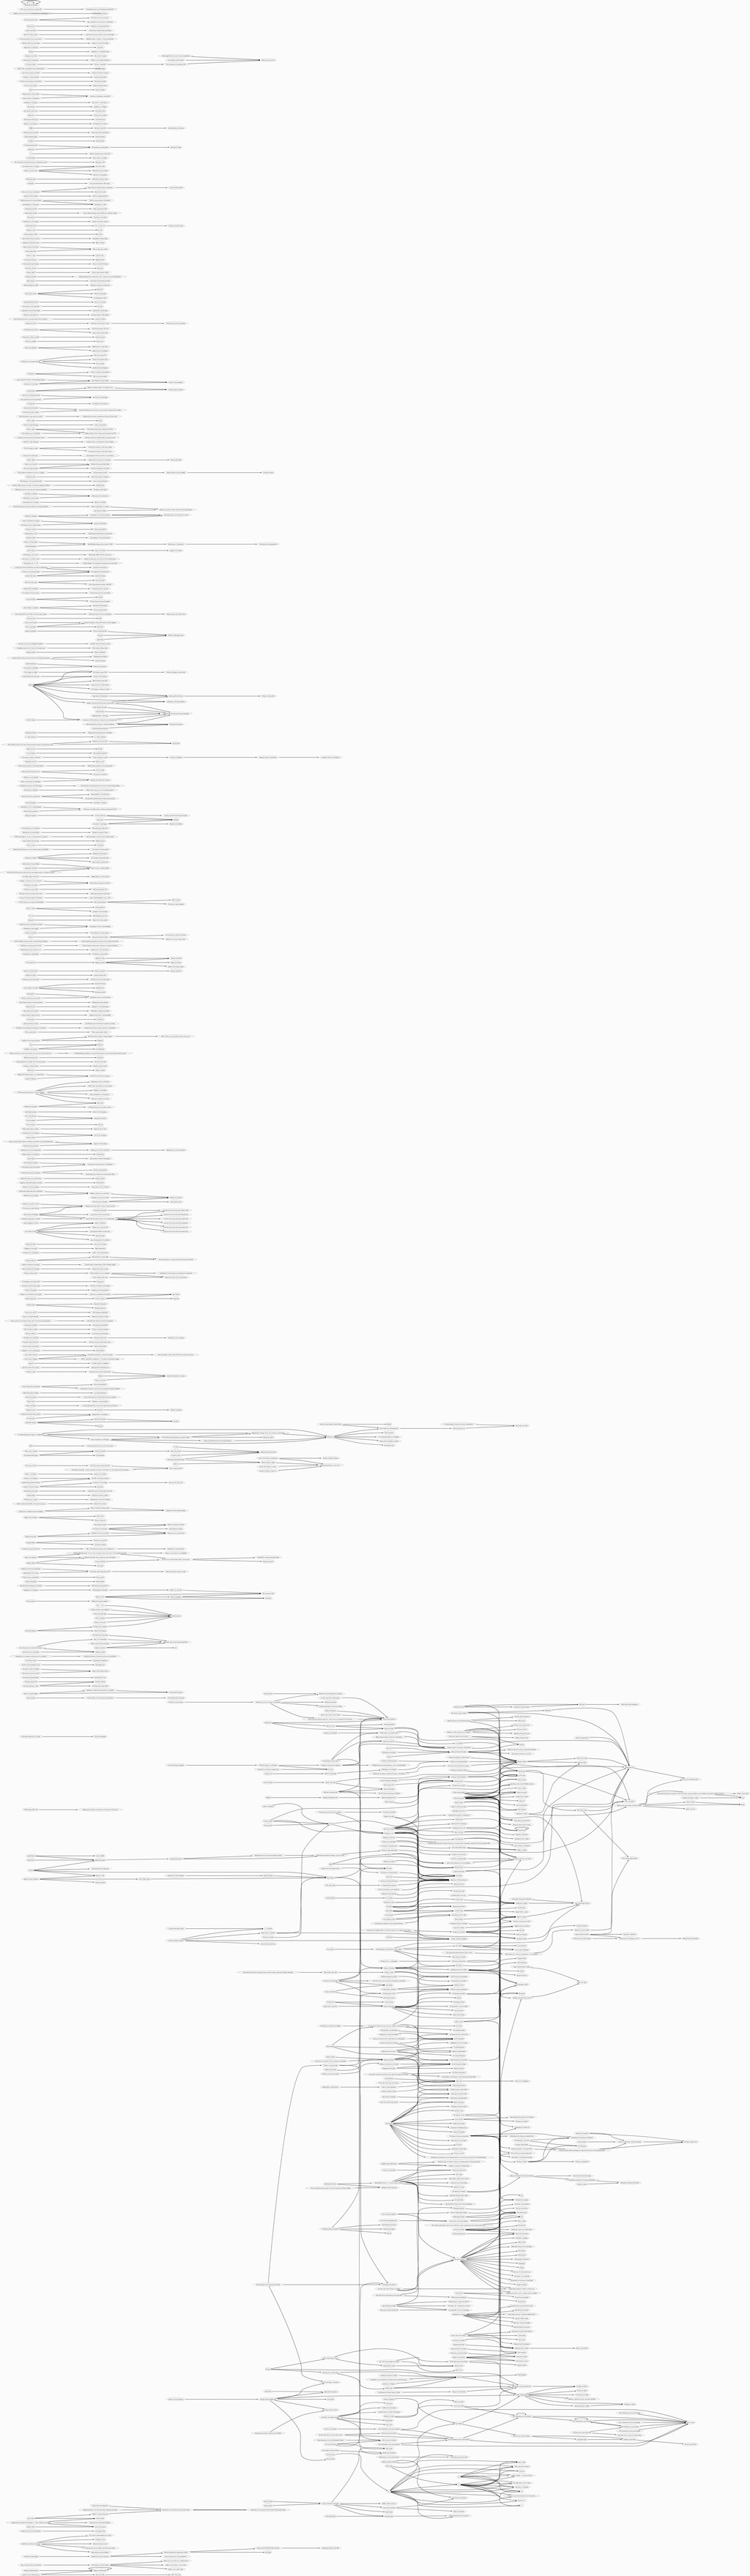
Even less comprehensible, but still interesting, is the “hierarchical” rendering in OmniGraffle:
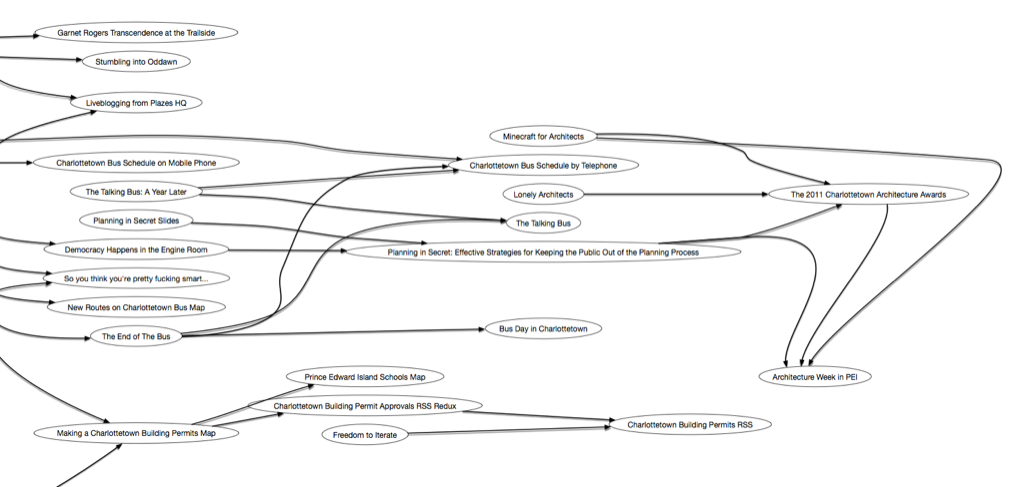
Here’s a detail of that rendering:
If you want to explore the rendering in more detail, I’ve exported a PDF file that you can zoom in and out of.
About This Blog
 I am Peter Rukavina and this is my blog. I am a writer, letterpress printer, and a curious person.
To learn more about me, read my /now, look at my bio, listen to audio I’ve posted, read presentations and speeches I’ve written, see things I’ve favourited elsewhere, or get in touch (peter@rukavina.net is the quickest way).
I have been writing here since May 1999: you can explore the 25+ years of blog posts in the archive.
![]() You can subscribe to an RSS feed of posts, an RSS feed of comments, an RSS feed of favourites elsewhere, or a podcast RSS feed that just contains audio posts. You can also receive a daily digests of posts by email. I also publish an OPML blogroll.
You can subscribe to an RSS feed of posts, an RSS feed of comments, an RSS feed of favourites elsewhere, or a podcast RSS feed that just contains audio posts. You can also receive a daily digests of posts by email. I also publish an OPML blogroll.
Instagram • YouTube • Vimeo • ORCID • OpenStreetMap • Internet Archive • PEI.art • Drupal • Github.
Add new comment