
Earlier in the year, in response to a post I wrote about salted capers, Jeremy Cherfas left a helpful comment.
Jeremy had found his way here, across the ocean from his home across the sea, via Ton’s link to my post about editing OpenStreetMap.
In the process of figuring out who this Jeremy was, and why he knew about capers, I came across his Annual Report for 2018, which he started with:
Monthly reports have been going more than a year now, even if I have missed a few, including last December. What to add for an annual report? I think this has to be a different kind of beast, more like a GTD high-level view. But there’s still room for some low-level stuff, down at the bottom, thanks to Exist.
I followed that link to Exist and found, on the other end, a delightful Australian project that enables one to aggregate personal analytics and, in theory, to gain insights:
By combining data from services you already use, we can help you understand what makes you more happy, productive, and active.
Bring your activity from your phone or fitness tracker, and add other services like your calendar for greater context on what you’re up to.
Both as a researcher and someone increasingly prone to seeking insight, this was a good tree for me to bark up, and I immediately started a trial, converting to a paid subscription after the 30 day free window. I’ve been using Exist every day since, and I’m just now, after 4 months, starting to see the faint glimmer of useful insights on the horizon.
Here’s a taste of what I track in Exist.
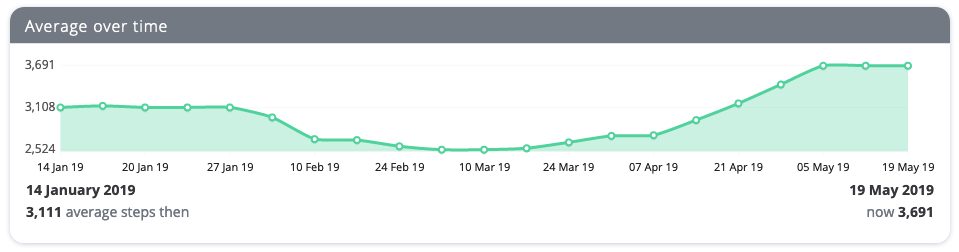
The Android phone in my pocket is running Google Fit, which counts the steps I walk each day.
I can see my steps per day, averaged by the week (the harshest part of winter was not good for my activity level):
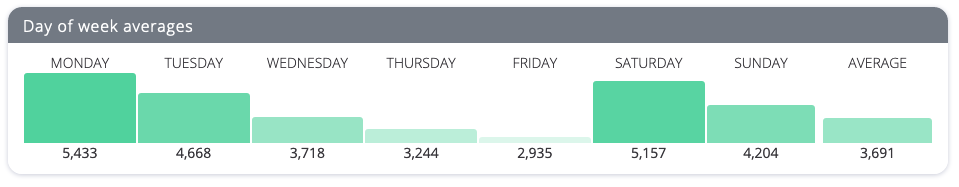
I can see which days of the week I’m most active (there’s a clear pattern here, with my activity level falling over the course of the work week, and then picking up on the weekend):
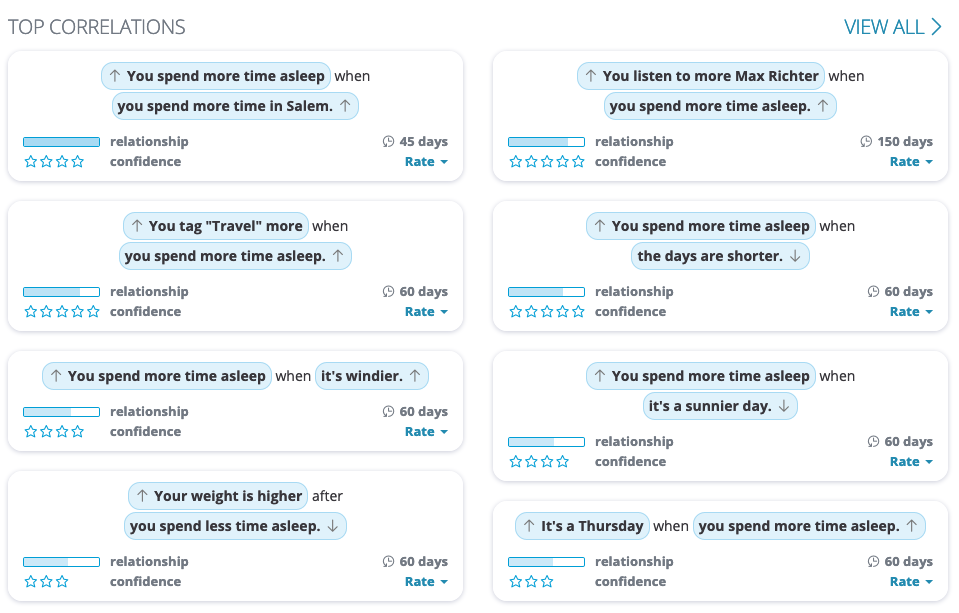
And I’m given a set of correlations between steps and various other things that I’m tracking. For example, I use Exist’s “custom tracking” feature to mark days with various tags of my own choosing. I use “Receiver” on days I visit Receiver Coffee, for example, “Lunchathome” for days when I eat lunch at home, and “Napeve” for days when I have a nap in the evening:
![]()
These charts tell me things like “I walk more when I travel” (common sense) and “I walk more when I don’t have a nap in the afternoon or a nap in the evening” (good to know).
Because I don’t wear a fitness or sleep tracker, but wanted to track my sleep, I used the Exist API to code up a tiny web app to allow me to manually enter my bedtime and wake time each day.
![]()
I’ve been tracking my sleep for two months now. The bump in late March and early April was due to vacation and work travel where, apparently, I get about an hour more sleep a night (I didn’t know that).
The bottom chart confirms that I sleep an extra hour on the weekend, that I get an average of 7:30 a night, and that I sleep a little more on Thursdays (for reasons unknown).
The sleep correlations that are surfaced are a combination of the not-very-useful (I may spend more time asleep when I’m in Salem, but I was only there for a single night), the curious (why do I sleep more when it’s sunnier?) to the delightful (the Max Richter album I have downloaded on Spotify is his eight and a half hour Sleep, “a piece that is meant to be listened to at night”; obviously it works).
I bought a Withings wifi-enabled scale in January when it was on sale, and I’ve been measuring my weight at the same time every morning, about 30 minutes after I get up.
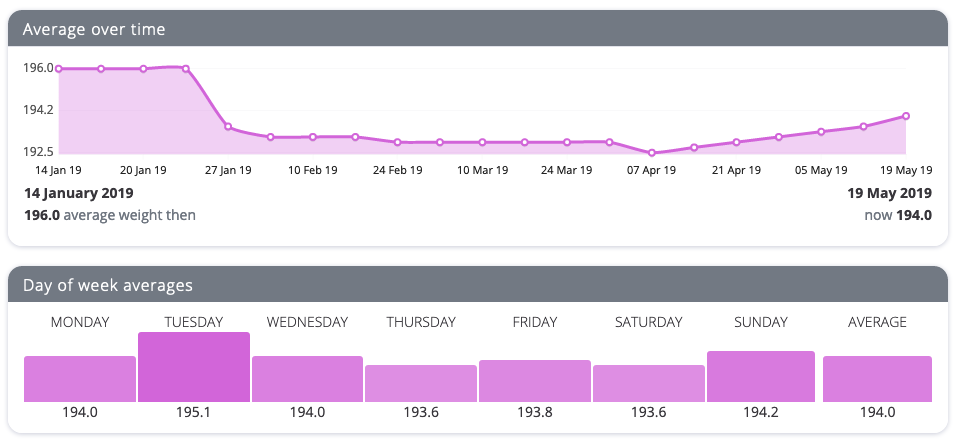
I think the readings in early January were an aberration caused by my entering a best guess for my starting weight into the Withings app, so it’s really only the week of January 27 onward for which I trust the data.
There’s not much to be gleaned from Exist’s attempts to correlate my body weight to other things, perhaps because it’s remained relatively consistent. It does tell me “your weight is higher after you’re not listening to music,” and “your weight is higher after you don’t tag Travel,” which are intriguing. Body weight, I think, is something best analyzed over a longer window than a season, so I’ll keep at it; certainly the ease of the wifi scale makes it dead simple to do so.
Another thing Exist is well setup to allow me to track manually is my mood. It’s a relatively blunt instrument, with only 5 gradations. And I’m not sure I’d ever dare to tag a day with a rating of “1,” as that would admit the depths of complete despair. But after 131 days of tracking my mood, I find myself surprised by the results:
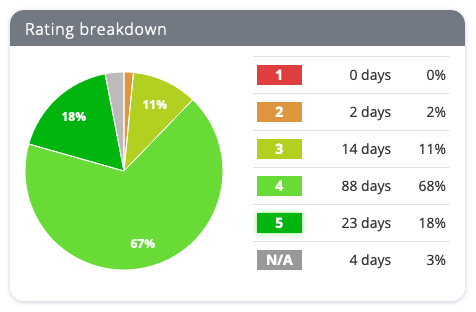
I’d been under the impression, perhaps because I’ve had a good run of mood, that I’d tracked almost every day as a 4, but, I learned from this chart, that only happens 68% of the time; 18% of the time I have a “perfect” day, and 13% of the time I rate my mood a 2 or a 3.
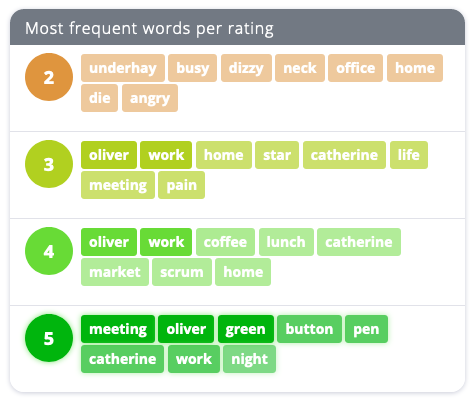
Along with entering a numeric mood rating, Exist also prompts me for some words or phrases to explain my mood; I found the aggregation of this really interesting:
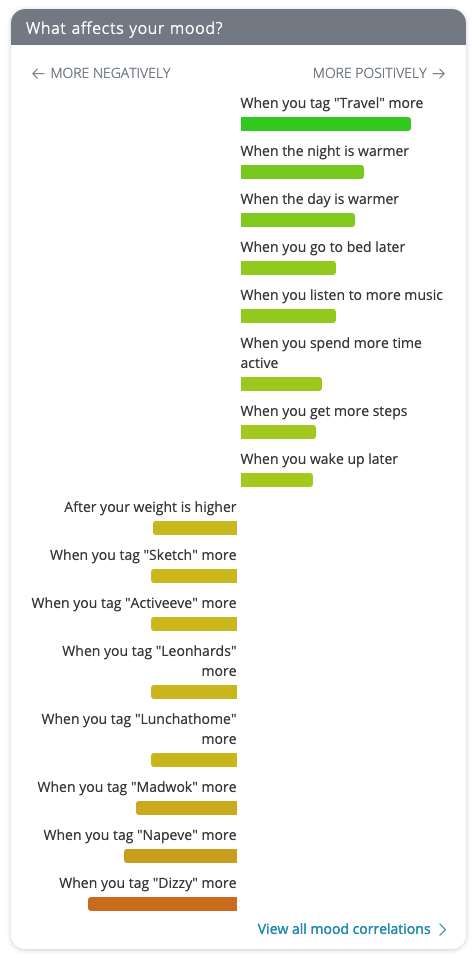
The closest that Exist comes to out-and-out recommendations for lifestyle changes is the “What affects your mood?” chart.
Following its advice I should travel more, to warmer places, stay up late, listen to music, stay active and sleep in, and I should avoid sketching, going to Leonhard’s for coffee, eating lunch at home, eating at Mad Wok, having a nap in the evening, and being dizzy.
While Exist is primarily tailored to allowing me to compare me to myself, it does occasionally venture into letting me know how I compare to the global average for all Exist users:
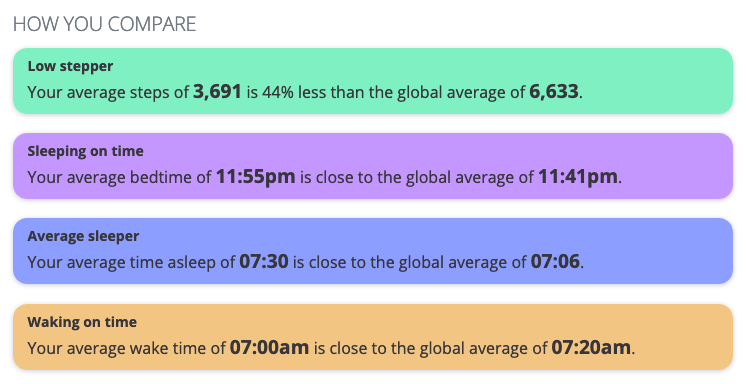
So I’m more sedentary than others (warning sign), but I go to bed and get up around the same time as everyone else, and sleep just a tiny bit more than average.
Beyond the joy of measuring, I enjoy using Exist because of the small team behind it, their sense of design, their openness to openness, their blog, and their quick turnaround for addressing support questions.
About This Blog
 I am Peter Rukavina and this is my blog. I am a writer, letterpress printer, and a curious person.
To learn more about me, read my /now, look at my bio, listen to audio I’ve posted, read presentations and speeches I’ve written, see things I’ve favourited elsewhere, or get in touch (peter@rukavina.net is the quickest way).
I have been writing here since May 1999: you can explore the 25+ years of blog posts in the archive.
![]() You can subscribe to an RSS feed of posts, an RSS feed of comments, an RSS feed of favourites elsewhere, or a podcast RSS feed that just contains audio posts. You can also receive a daily digests of posts by email. I also publish an OPML blogroll.
You can subscribe to an RSS feed of posts, an RSS feed of comments, an RSS feed of favourites elsewhere, or a podcast RSS feed that just contains audio posts. You can also receive a daily digests of posts by email. I also publish an OPML blogroll.
Instagram • YouTube • Vimeo • ORCID • OpenStreetMap • Internet Archive • PEI.art • Drupal • Github.
Comments
I like how open they are
I like how open they are about their business: https://hellocode.co/stats/
Do you think that eating at
Do you think that eating at Mad Wok makes you mad; or that when you are mad, you tend to go to Mad Work to eat? (Just wondering about correlation vs causation in the analysis. Interesting stuff!)
I guess it's for you to guess
I guess it's for you to guess which way the causation goes, when the correlations suggest one. You made me wonder if it weren't because you were in a better mood already that you stayed up late...though writing that now I remember insomnia correlates with depression...so besides to remember that correlation is not causation (CINC?), maybe to keep in mind GIGA.
Add new comment