
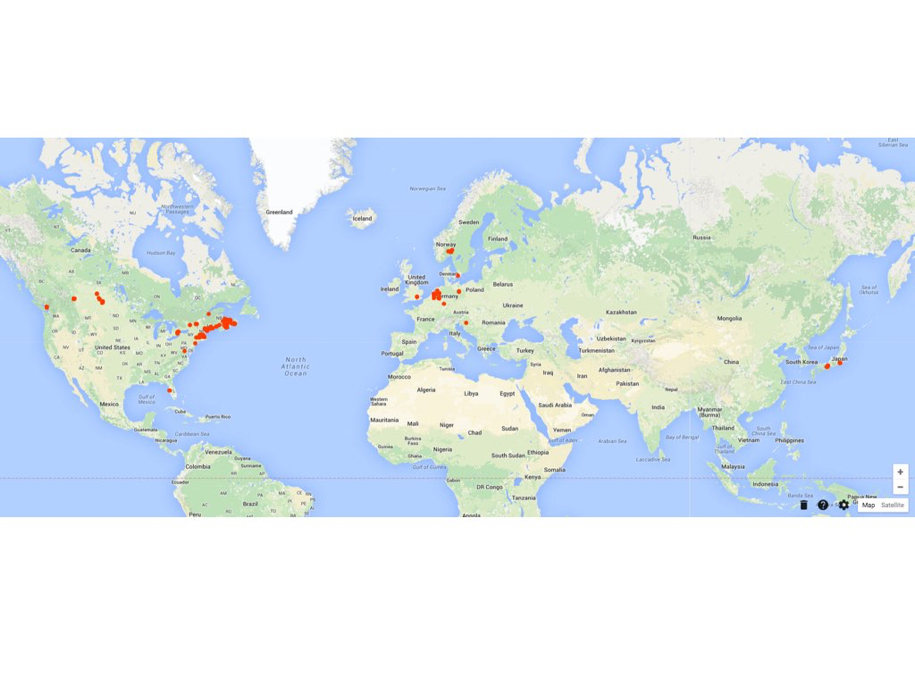
Today was my final lecture of four in the Philosophy 105 course I’ve been guest-teaching this winter (see reports from lectures one, two and three). I’ve taken the students on a diversion from the regular text and the regular path through the “philosophy of technology, values and science” so today was an opportunity to try to knit the various tangents I’d gone on together. As my overarching goal for my four lectures was to drop into the world of “open” – source, data, government, society – as a philosophical approach to technology, using my own experiences as a jumping off point, I opted to use OpenStreetMap, the open project I’ve spent the most time lurking in, as the focus for today. And so we opened with The Map:
I then led the students through a visual history of maps of Prince Edward Island – helpfully mined from IslandImagined.ca – from 1666 to the current day:
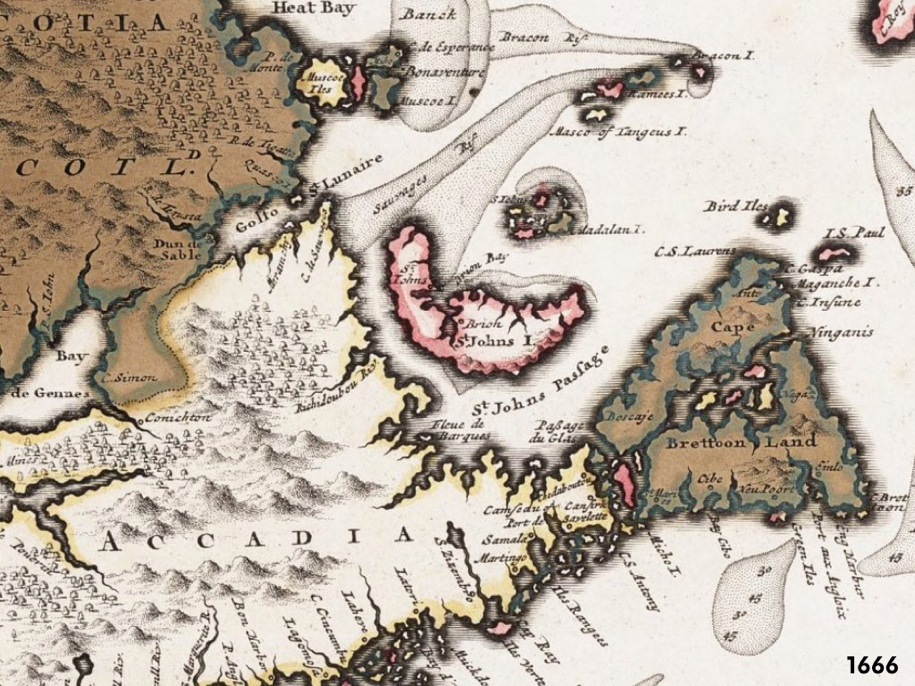
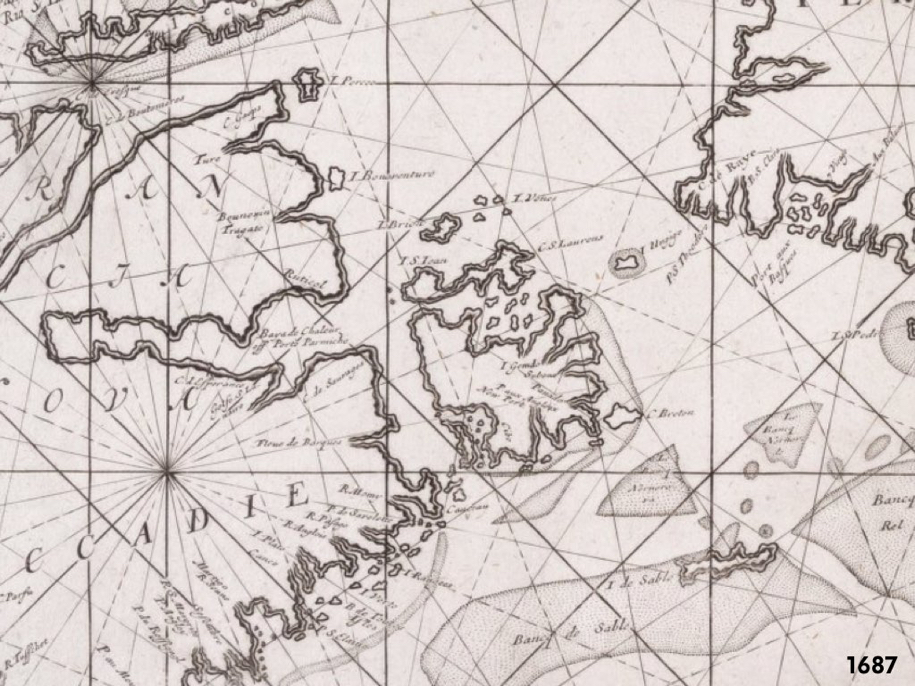
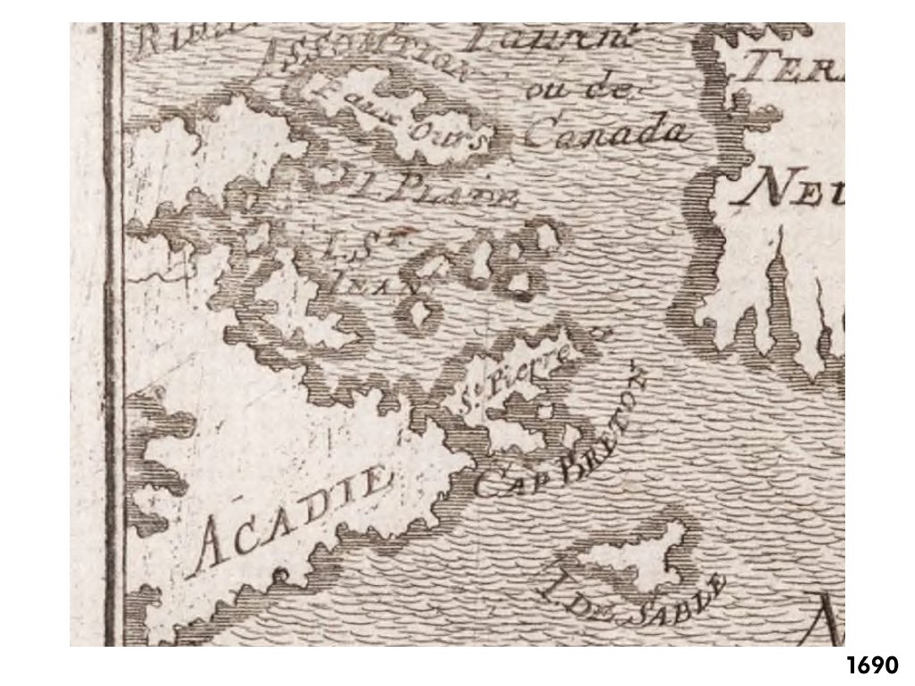
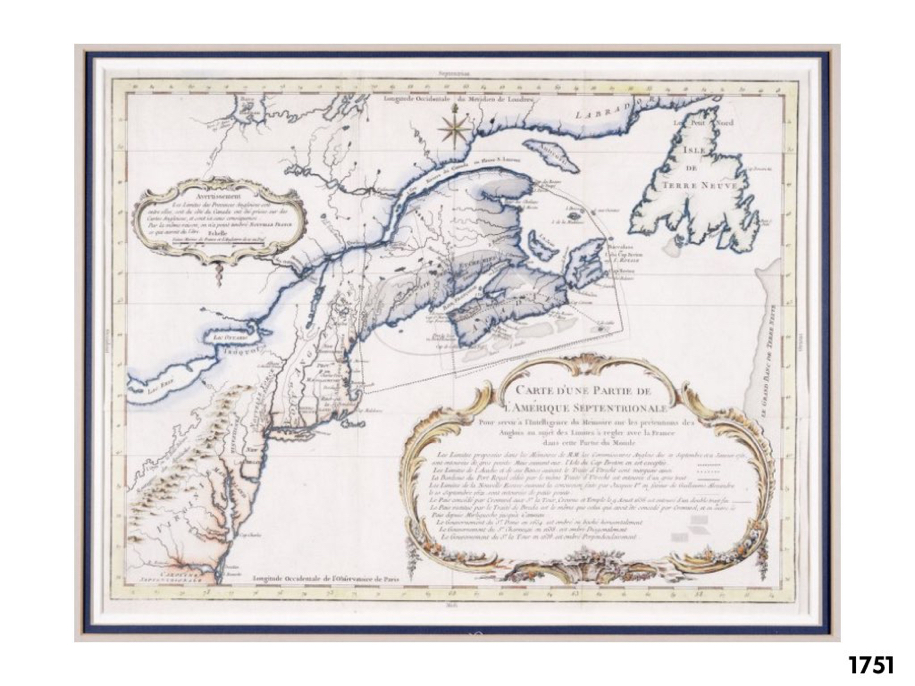
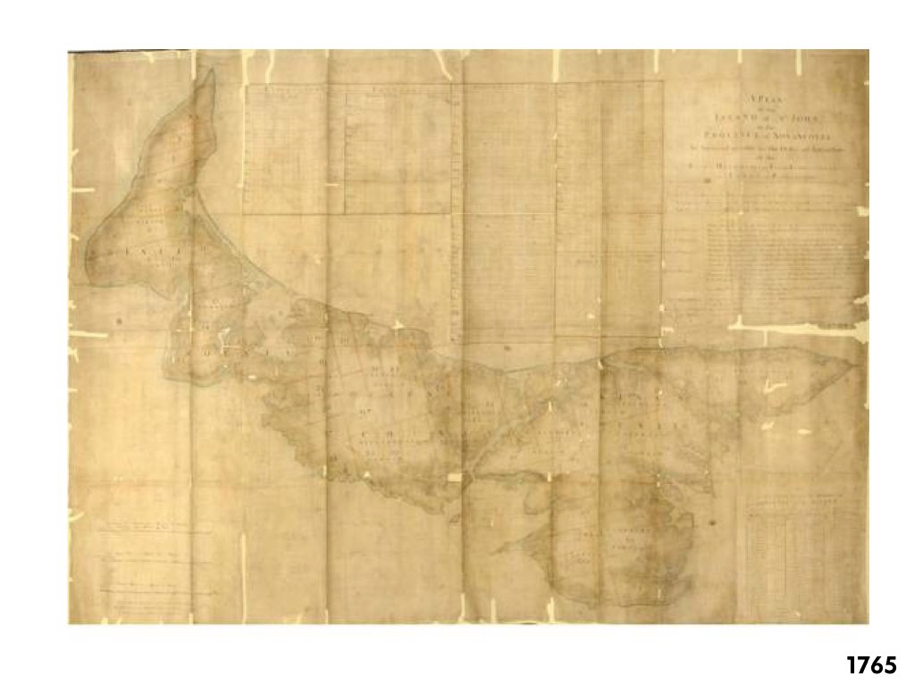
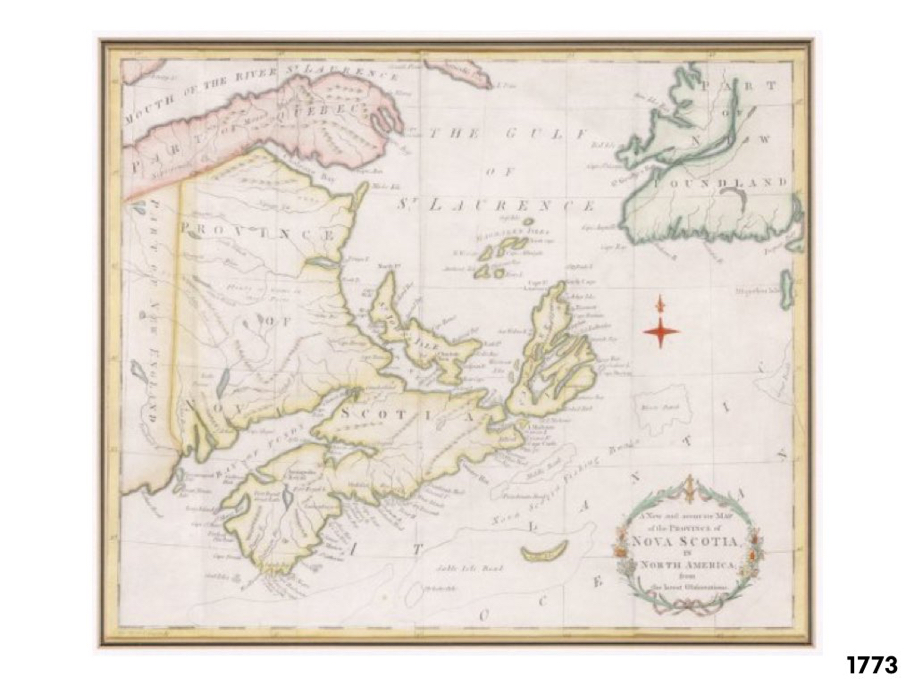
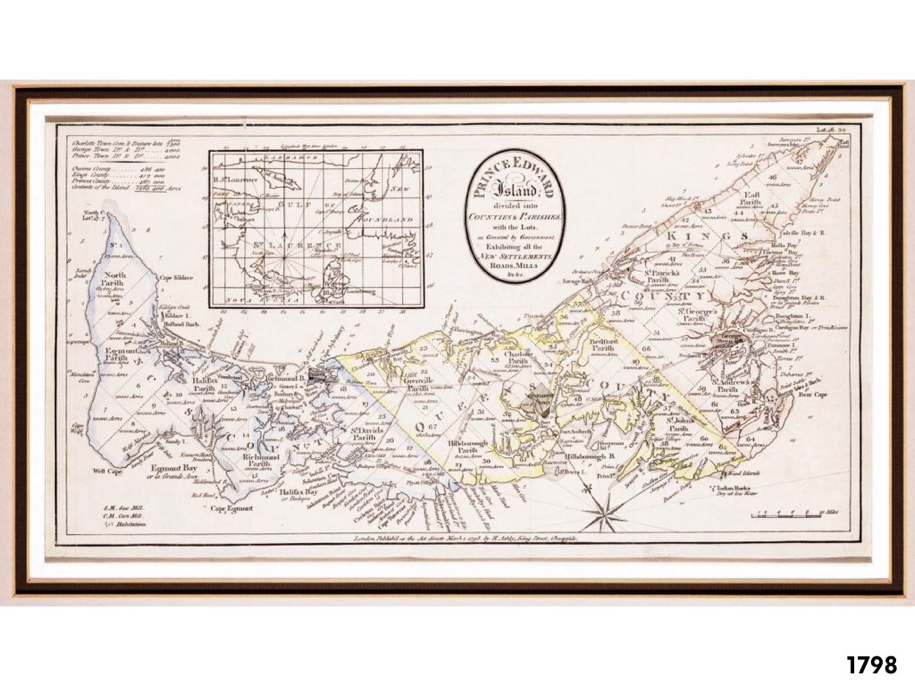
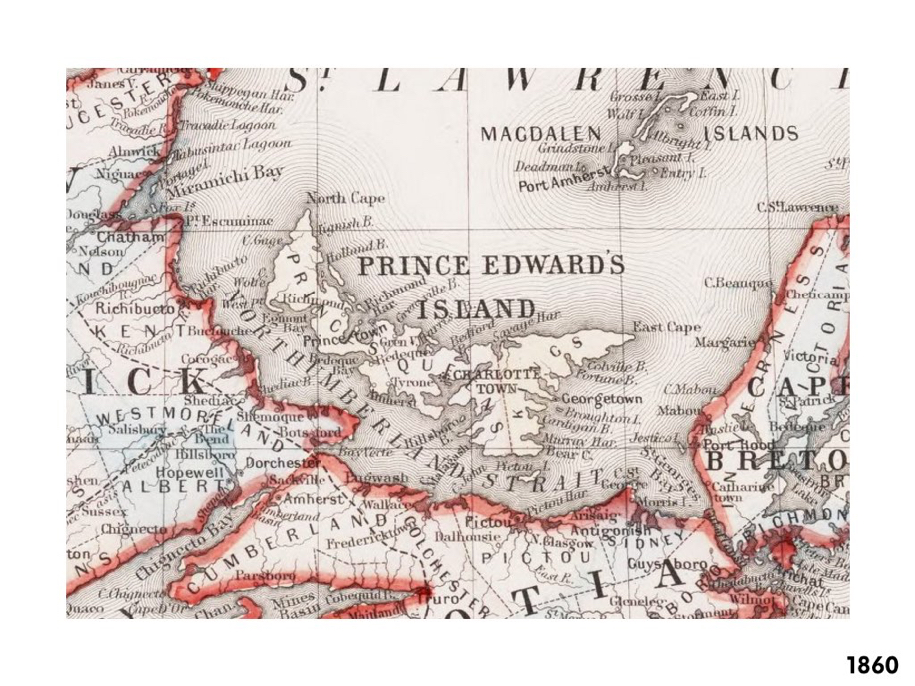
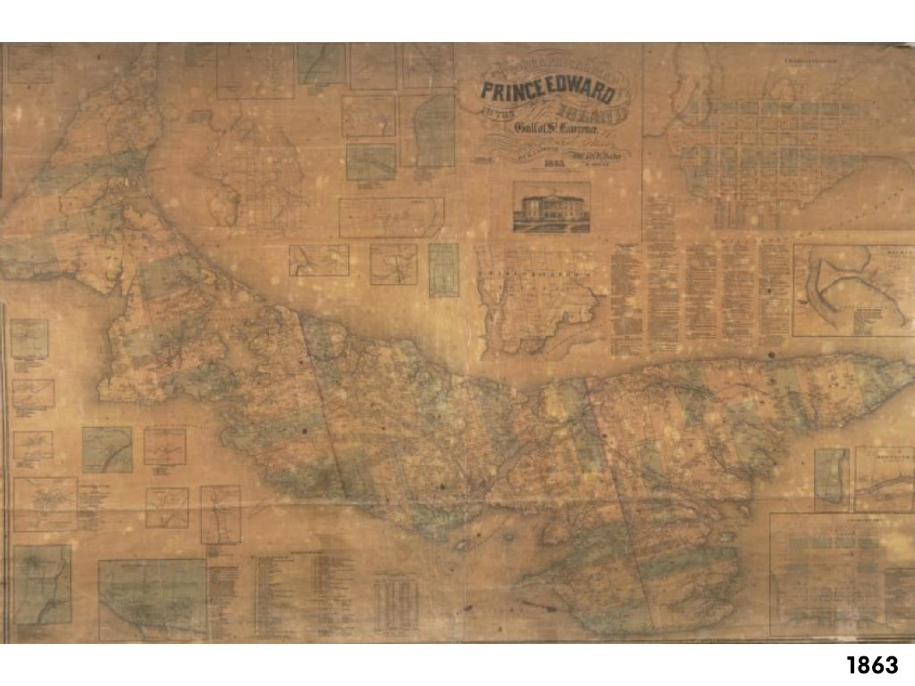
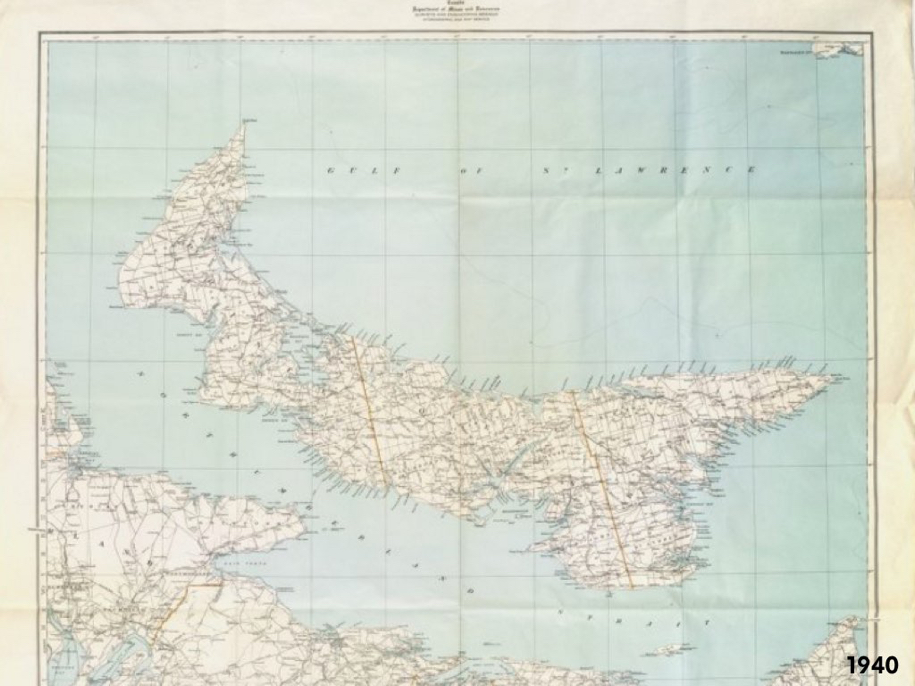
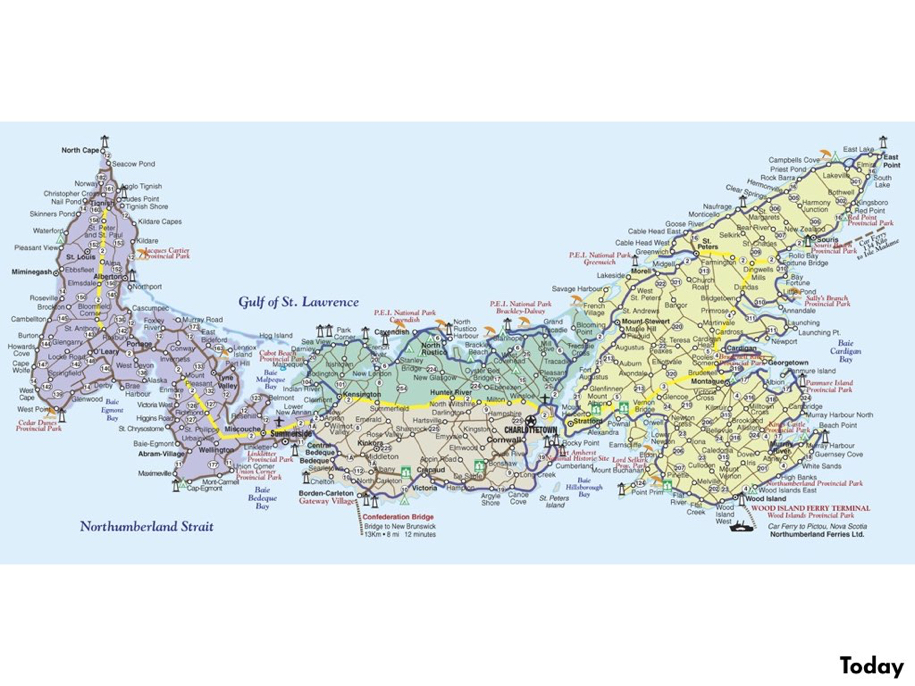
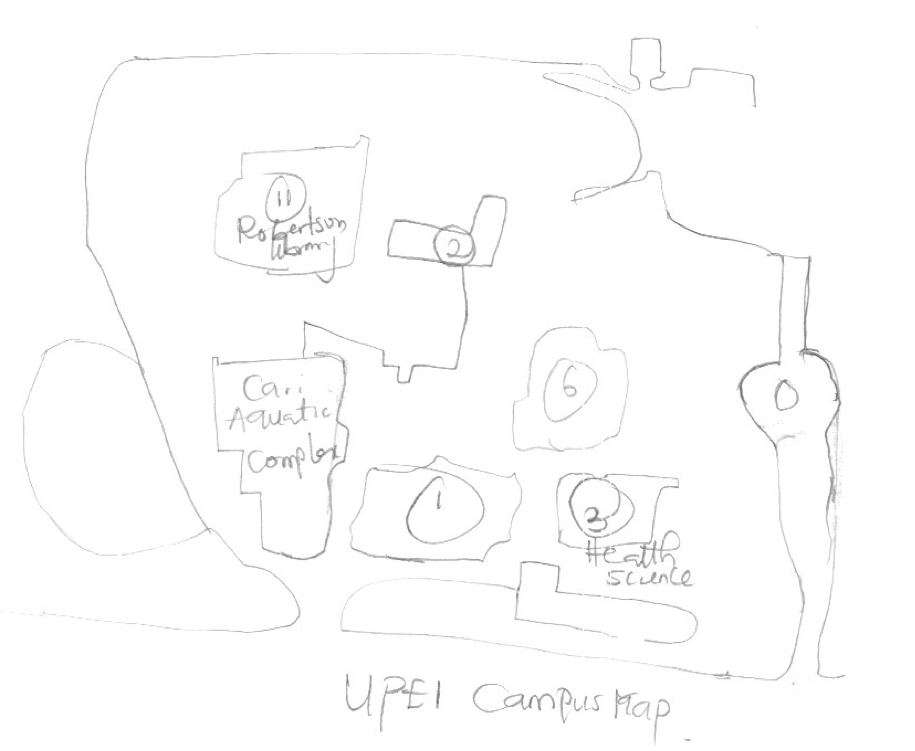
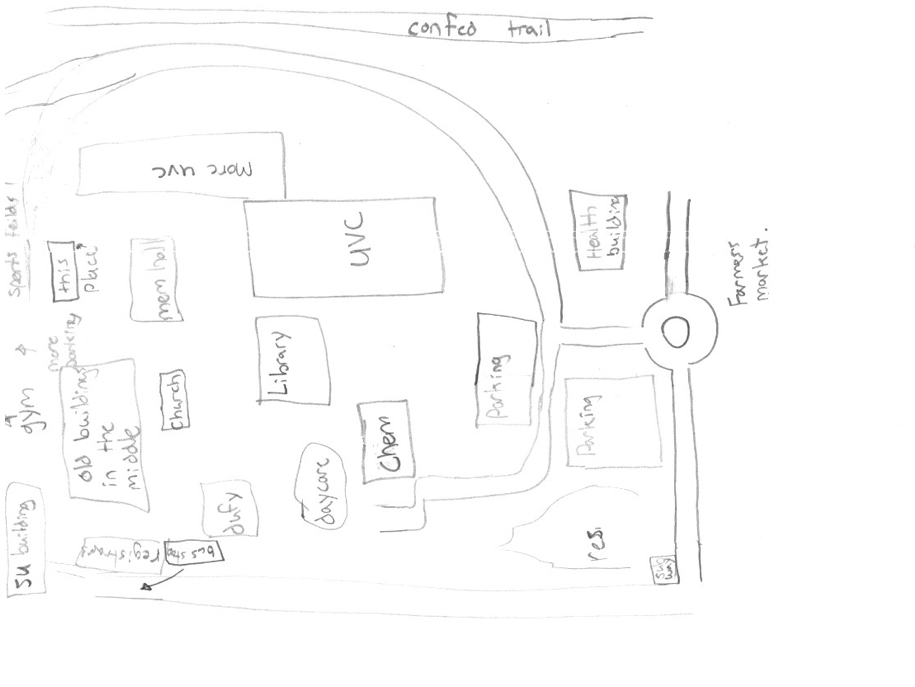
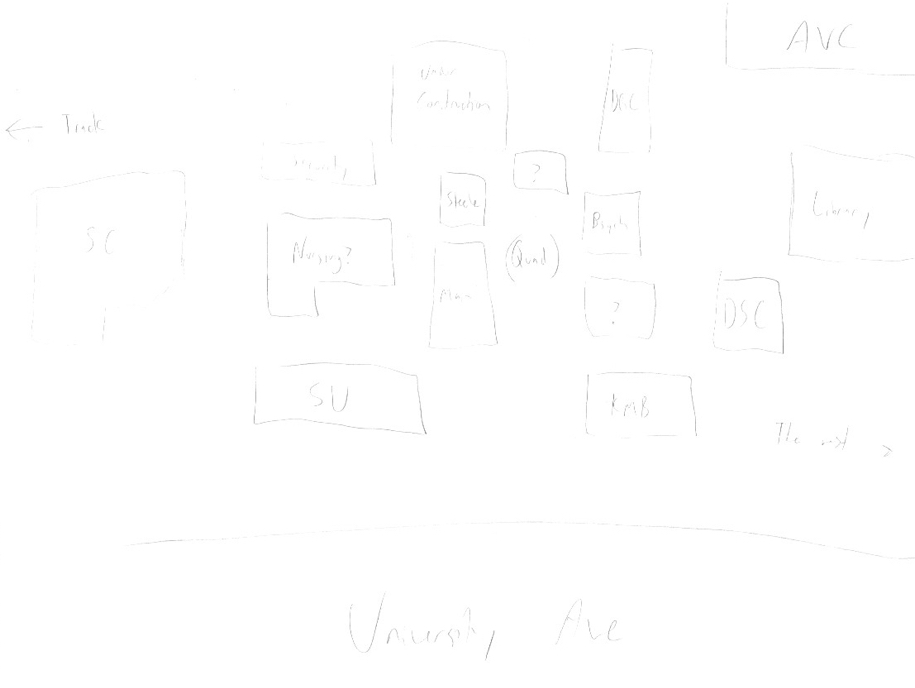
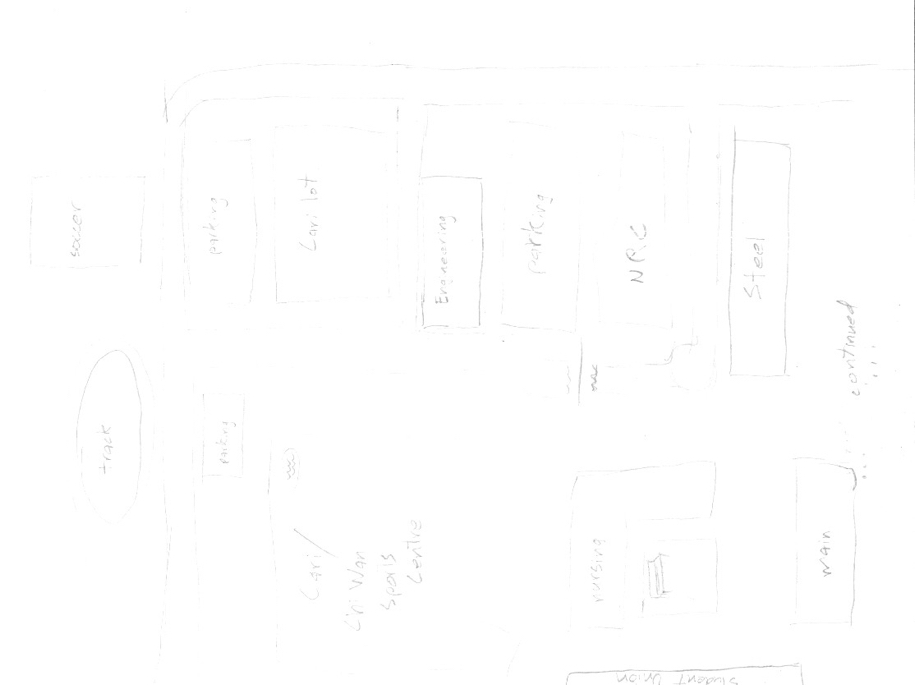
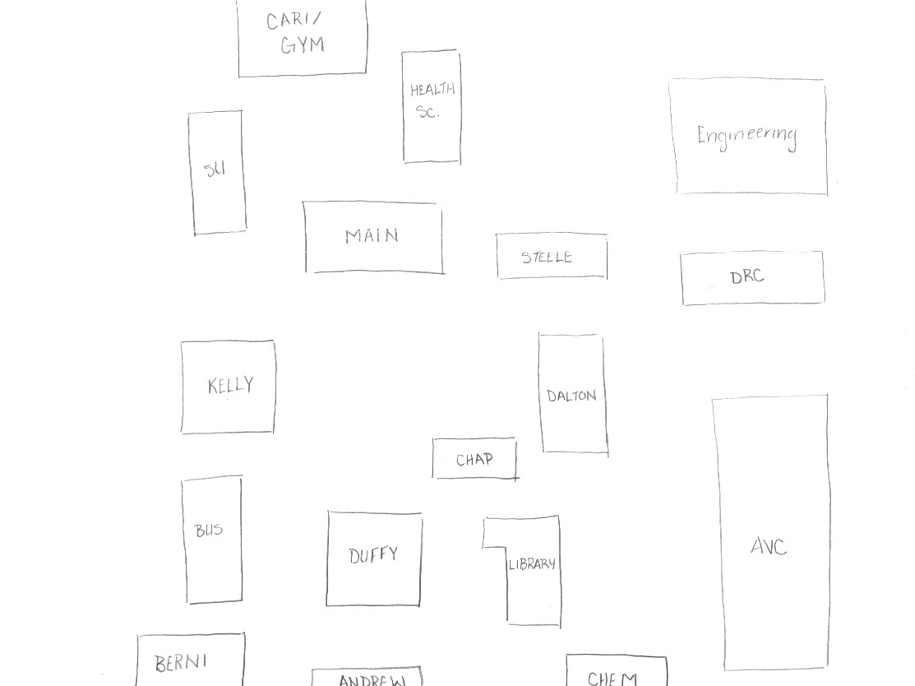
I wanted to reinforce that maps exist in a cultural context and a technology context: evolutions in our ability to measure, to communicate and to print all influence the maps we can produce, and the maps we can produce influence our mental model of where we live. In this spirit, I then presented the students with a quick challenge: take 5 minutes, a sheet of card stock and a pencil, and make a map of the University of PEI campus, suitable for handing to a new student who needs to get their bearings.
The results of this exercise – I gave them about 10 minutes to finish – were very interesting: 10 students prepared 10 very different maps, with different levels of detail, perspectives, orientations, levels of accuracy, style. I posted all of the maps on the whiteboard at the front of the classroom and asked them all to come up and take a look at them, and to compare and contrast their own maps to others. I didn’t need to say any more: the results proved the point that maps have politics, maps have limitations, maps represent the world view of the creator and the tools available to them.
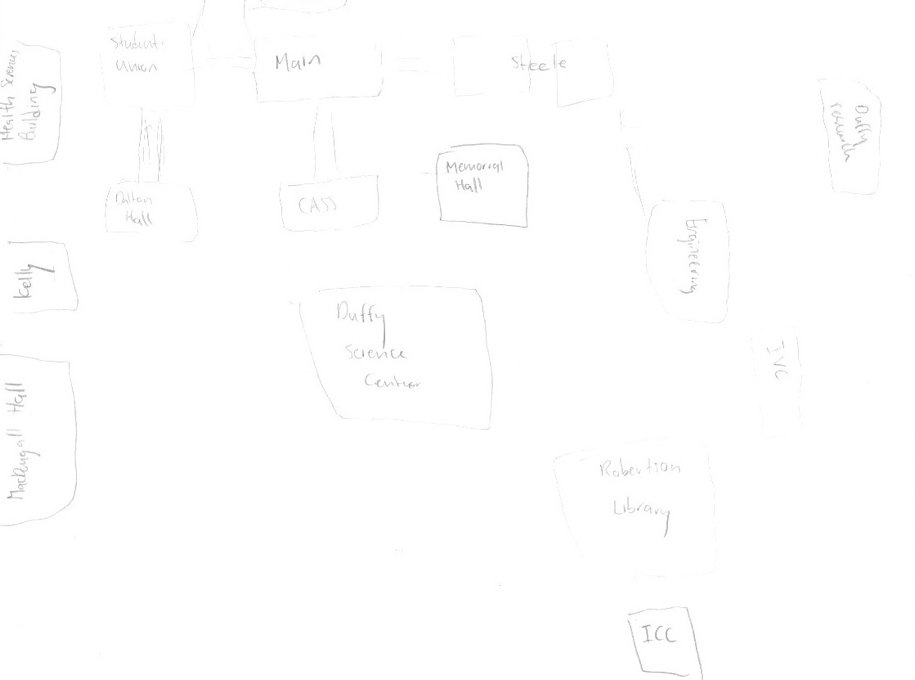
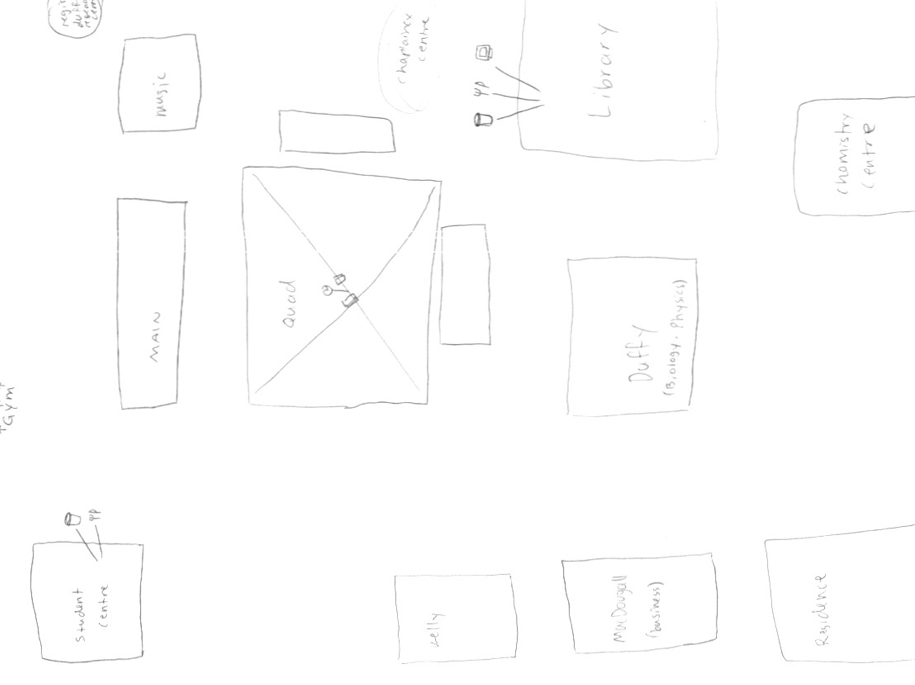
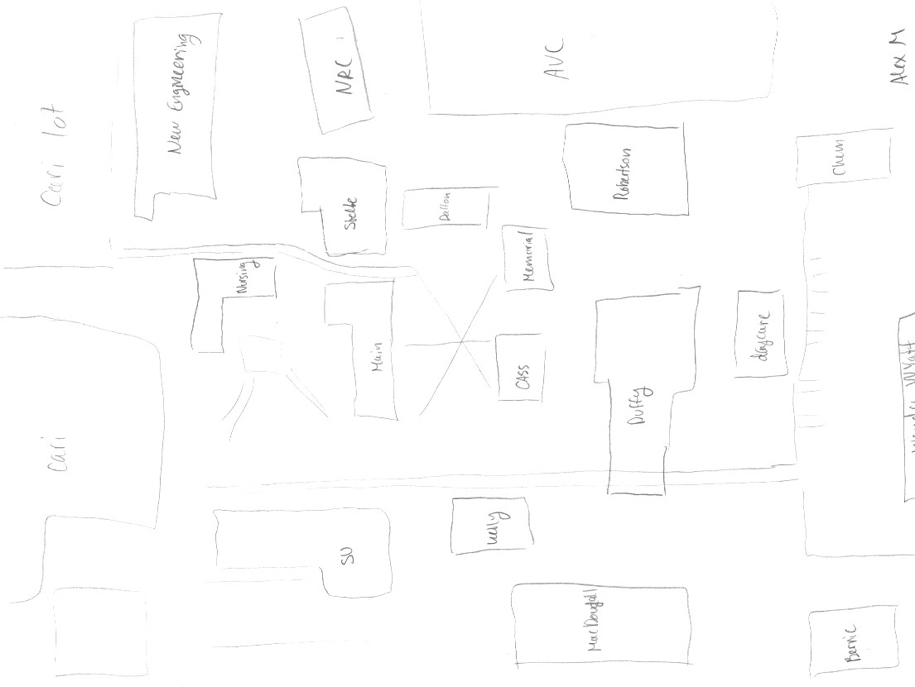
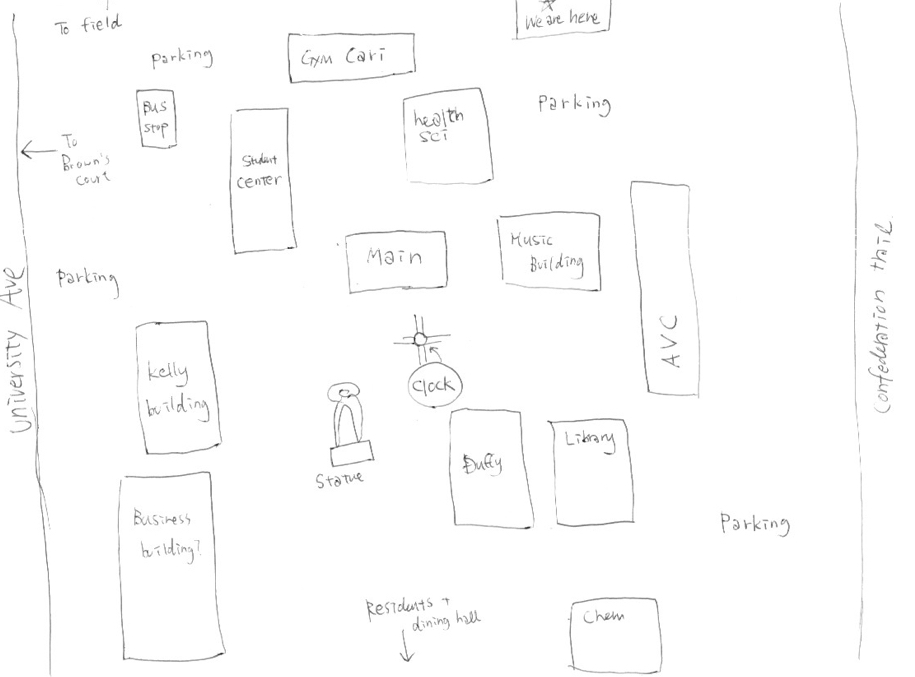
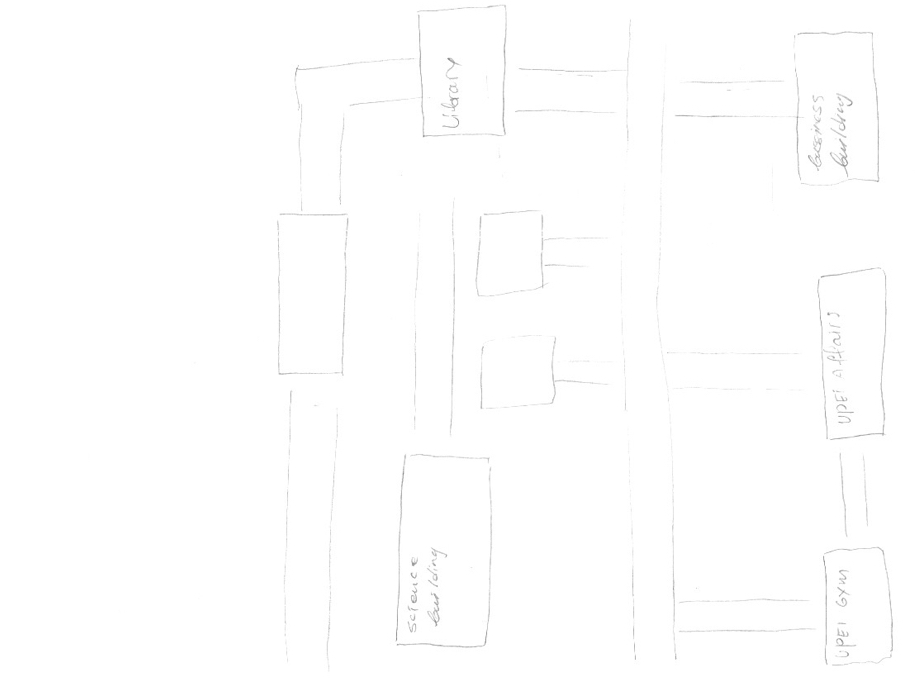
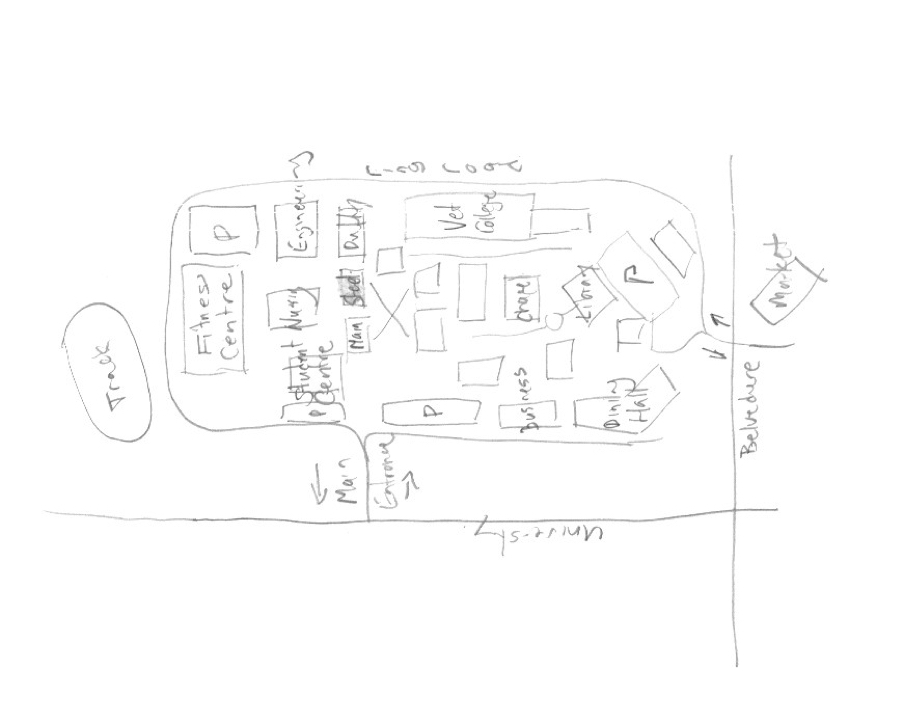
I threw my own version of the map into the ring for comparison (I created it at the same time as the students were creating theirs, and that in itself was a learning experience for me):
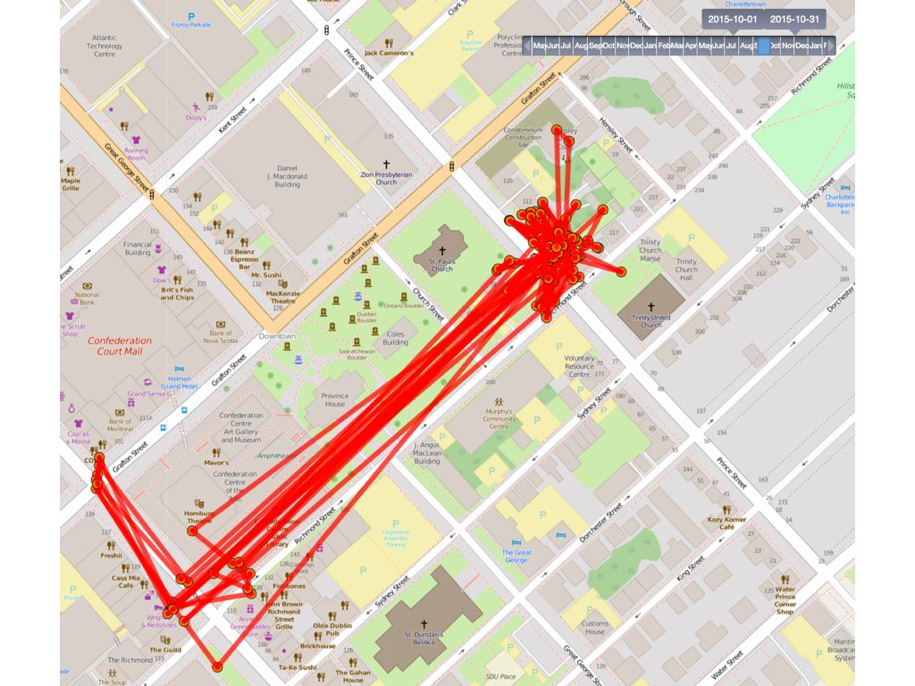
With the scene set, I then walked the students through a series of slides that illustrated how I leave a “digital breadcrumb” wherever I go, and how the collection of those breadcrumbs together tells a set of stories, and leaves a digital fingerprint of my passing:
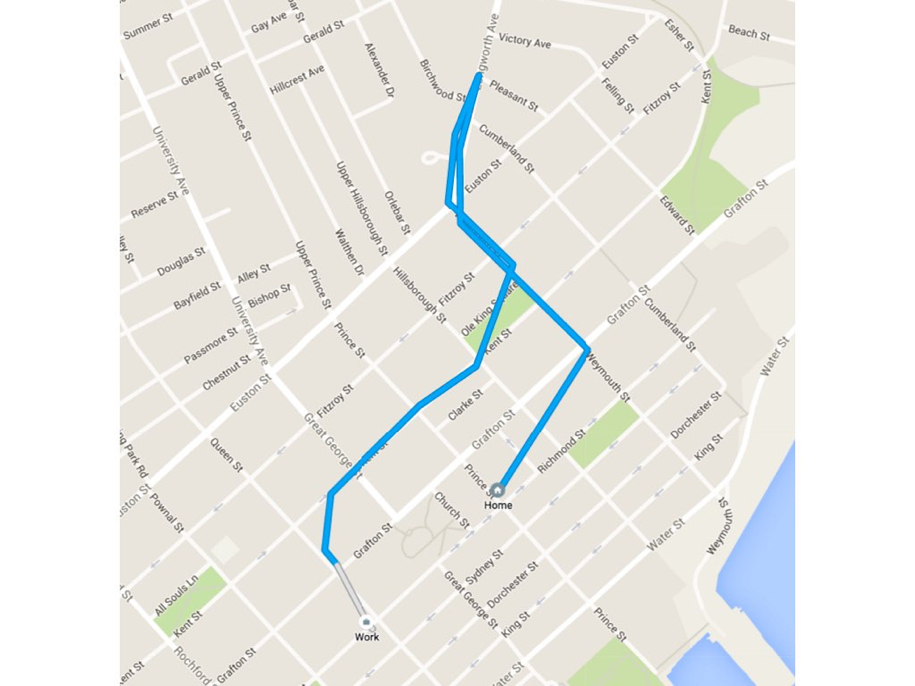
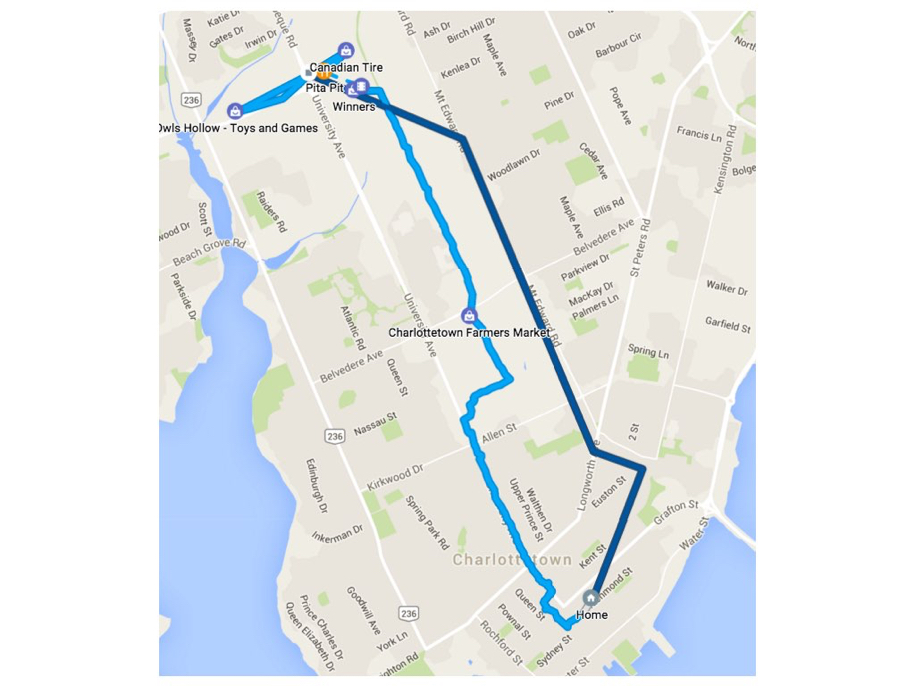
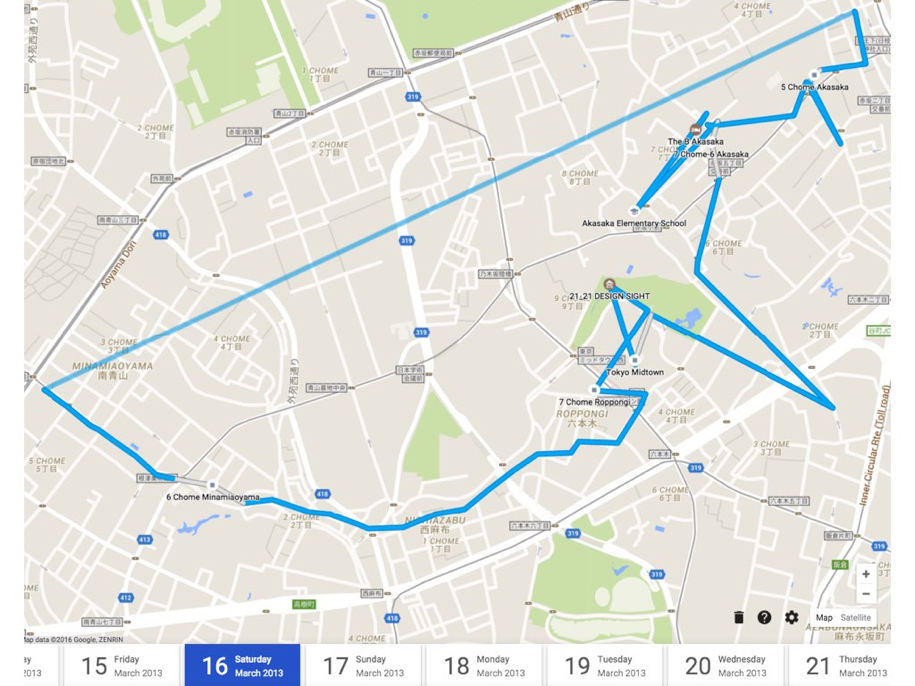
I then showed how the same data, from the same phone, also shared with Google, and thus merged with what Google knows about the world, can result in more meaningful (but also, possibly, more creepy) maps, like this map of my walk to Birchwood with Oliver this morning:
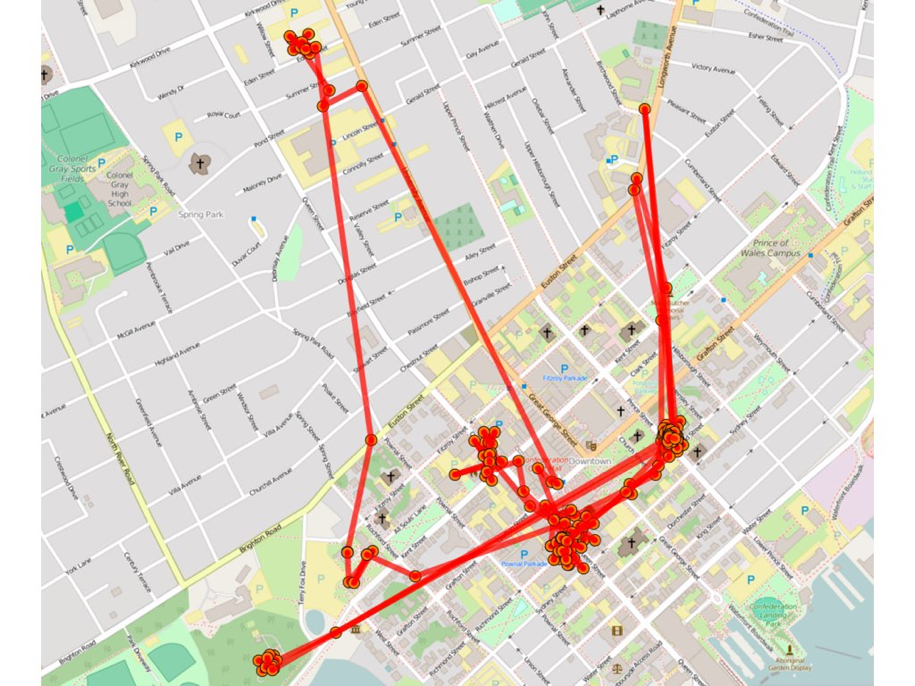
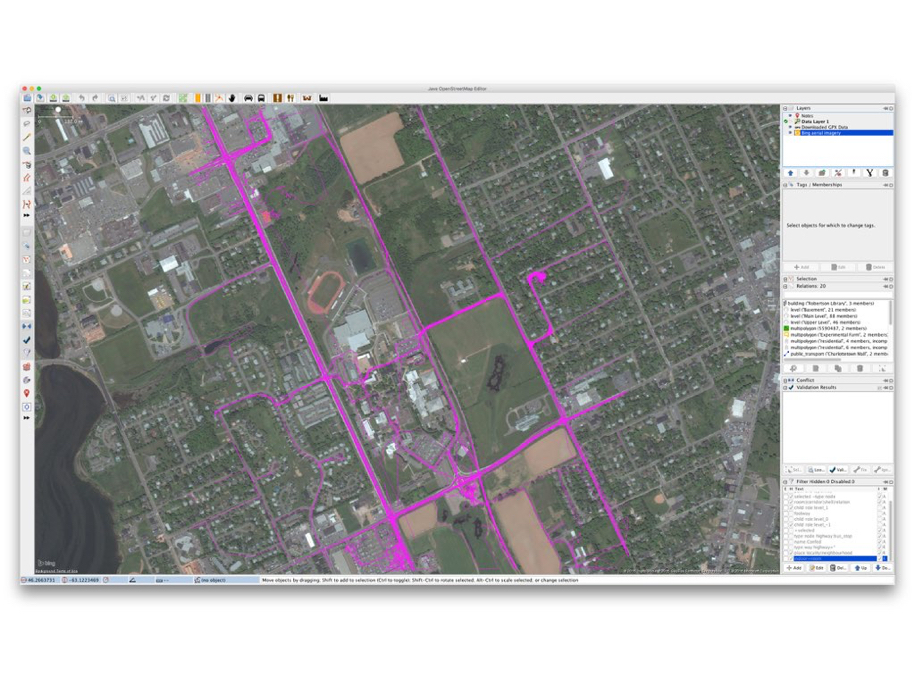
With the notion of “meaningful breadcrumbs” established, I then asked the students if they could identify this:
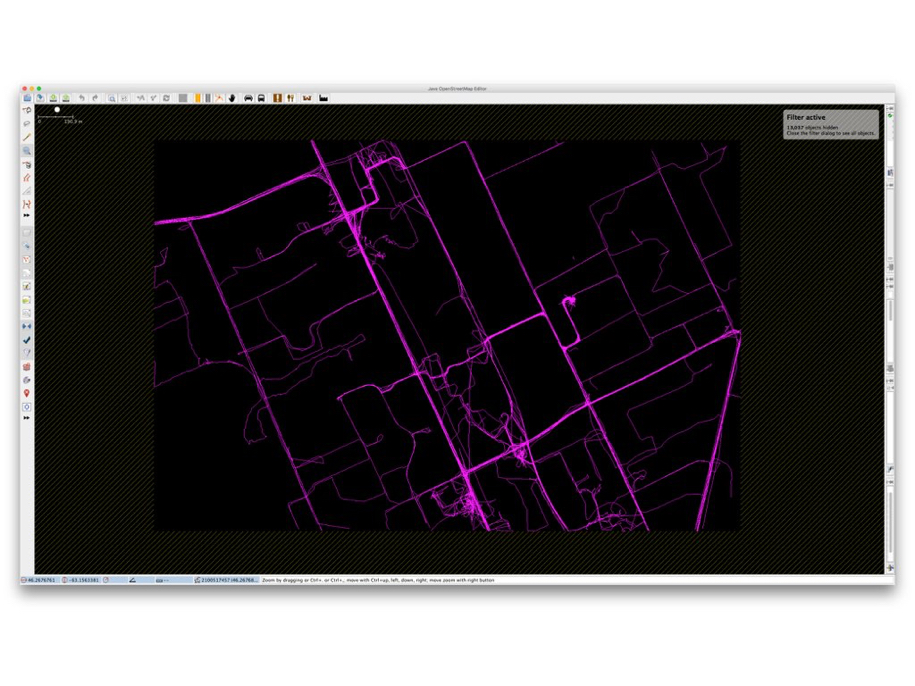
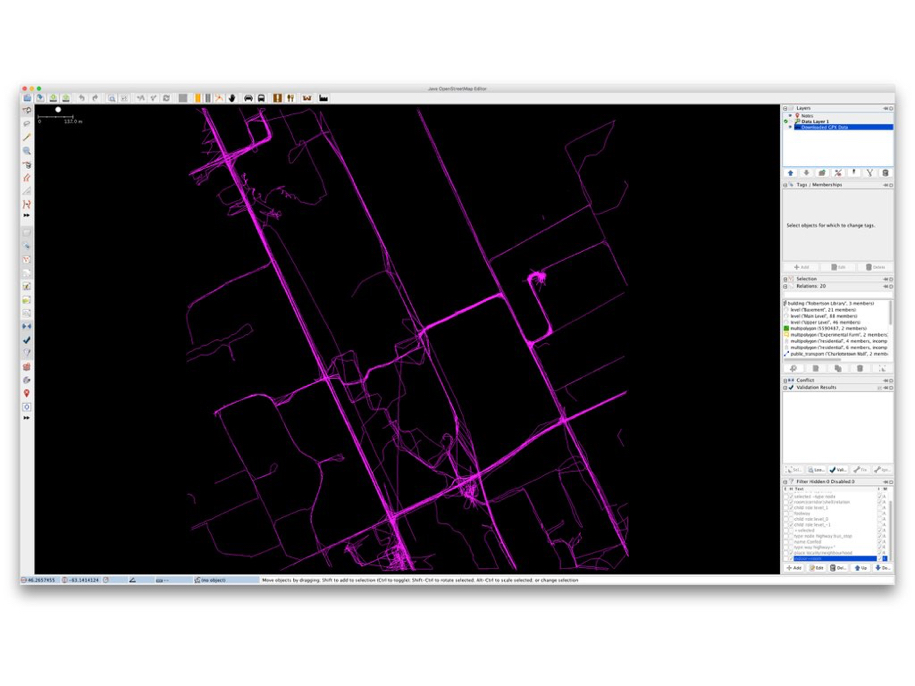
When they couldn’t guess, I added a hint:
The running track was the clue that was needed to identify the location as the University of PEI itself, and I explain that the purple traces were the collected GPS traces of OpenStreetMap contributors, traces that, in enough volume like this, carve a sort of de facto map of the city.
Next, to introduce OpenStreetMap, I showed an introduction to the project by its founder Steve Coast:
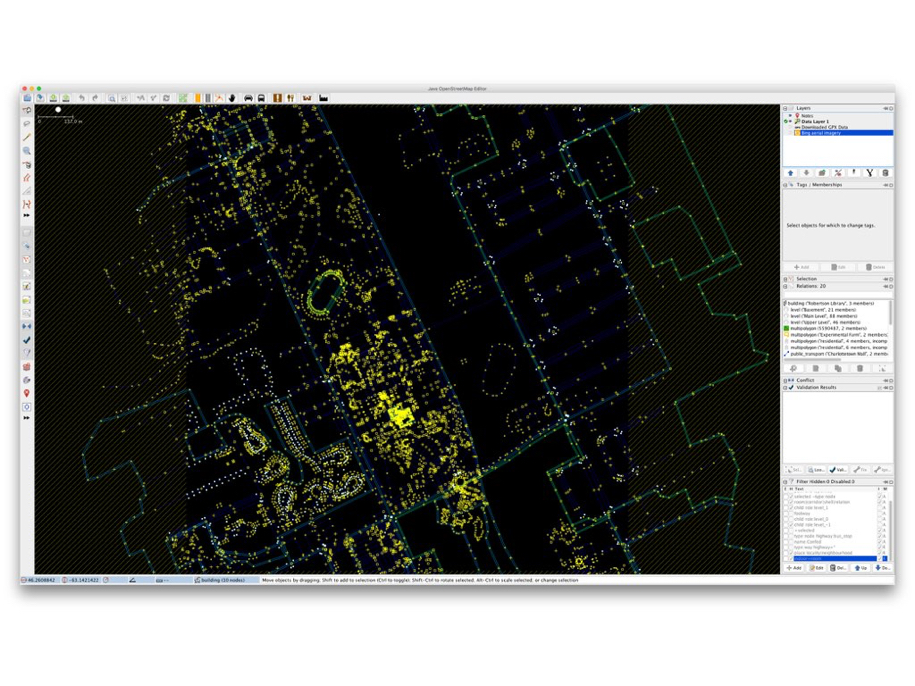
By way of introducing the underlying technical philosophy of OpenStreetMap, I discussed how, at its core, it’s about points, lines and areas, like this:

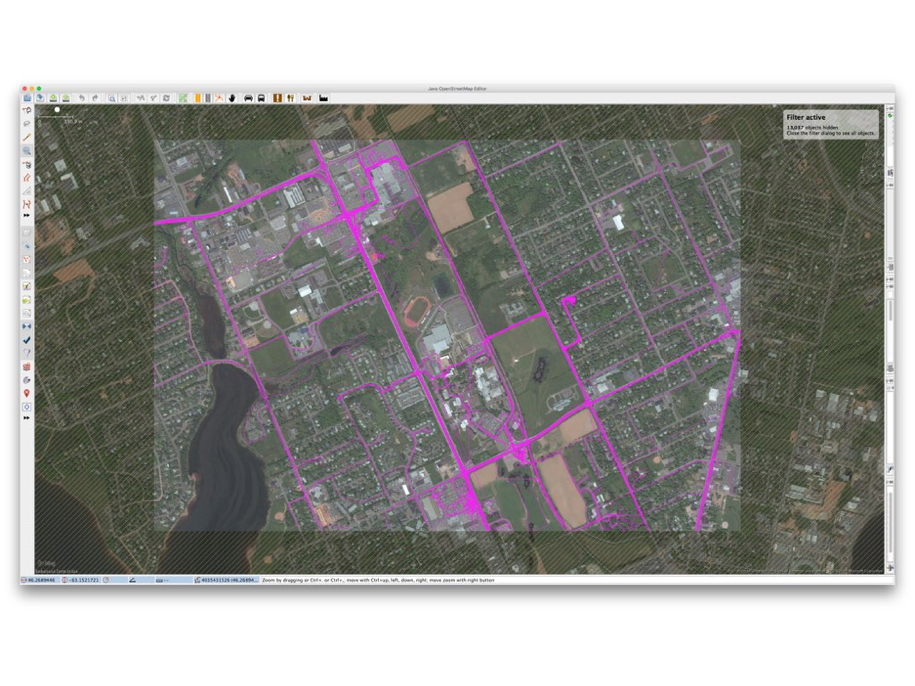
Using those primitive elements, OpenStreetMap allows these GPS traces:
combined with satellite maps with a license that allows for tracing:
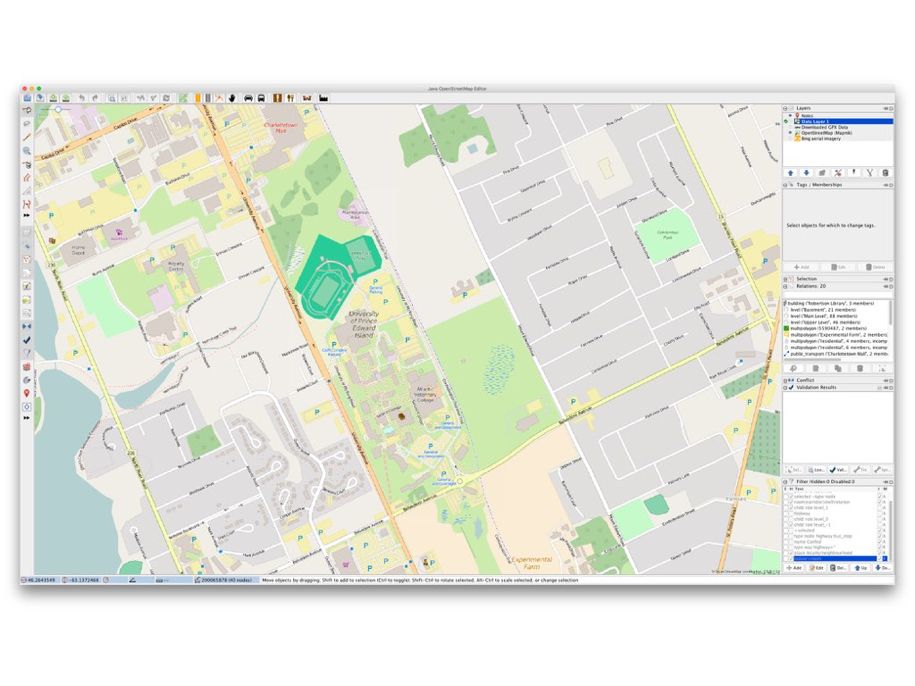
to be used to create features, and then to tag those features with metadata – this is a road, this is a path, this is a building, etc. – to create the raw materials for a map:
A map that, when a set of rendering rules are applied to it – make residential roads white, major roads orange, grass green, etc. – results in a human-readable map like this:
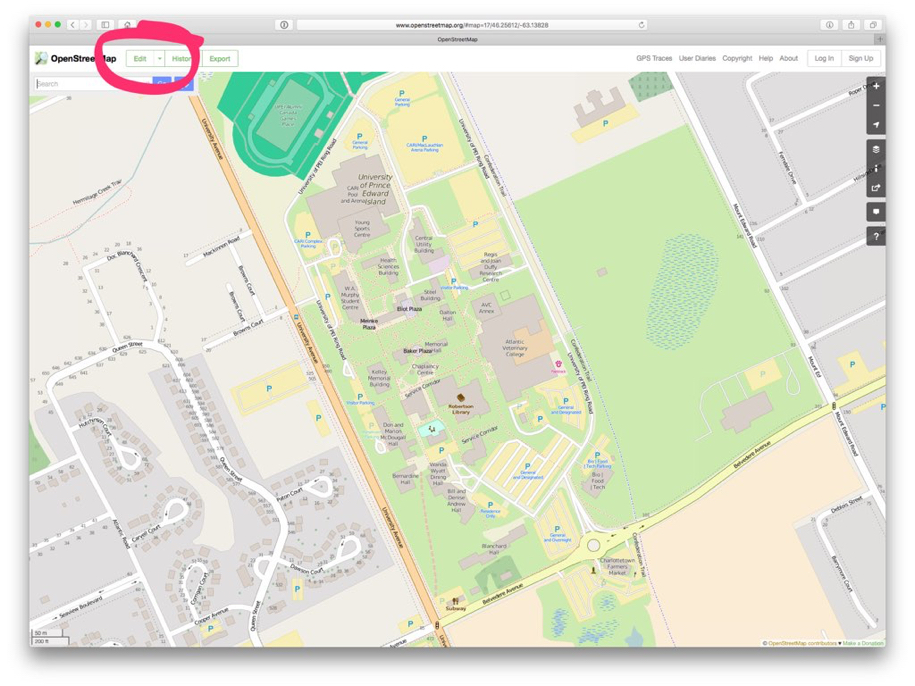
And that this is something that can be done not only with purpose-built standalone software, but in a web browser, by anyone, just by clicking “Edit”:
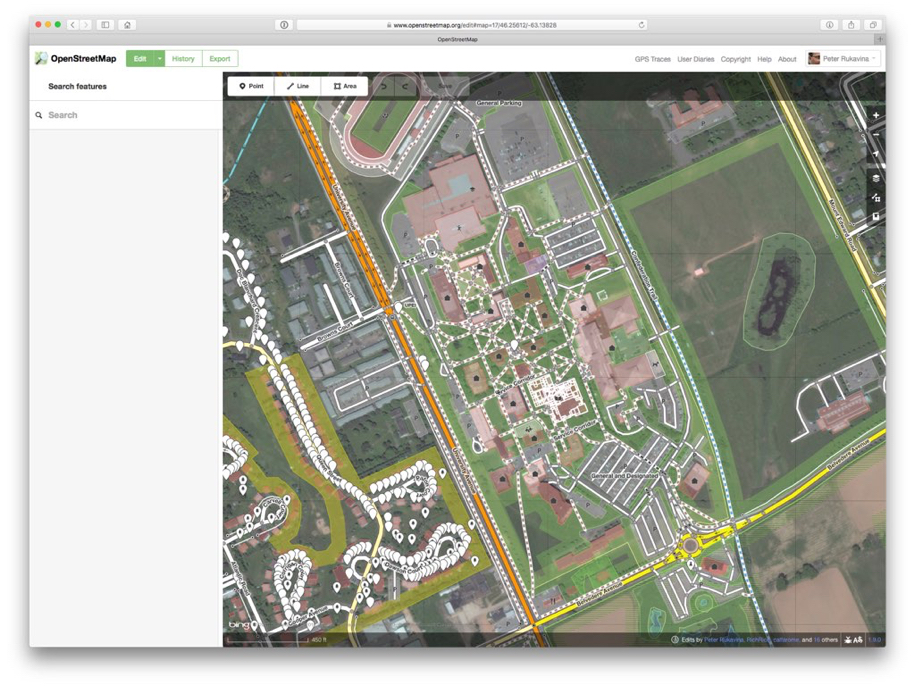
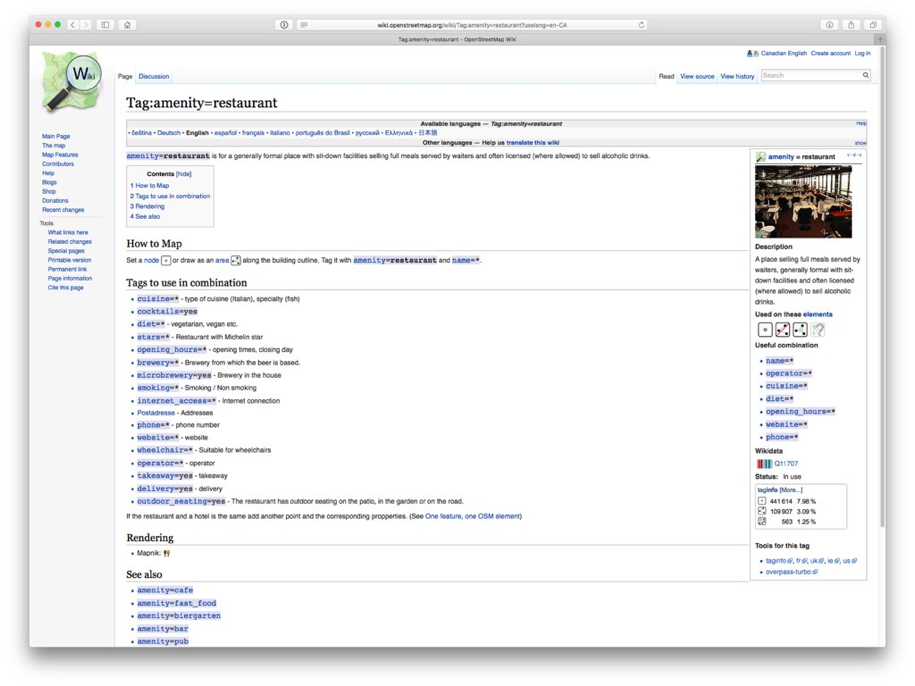
I demonstrated how the map itself a collaborative, open project, but also how the standards that drive them map – how to tag a coffee shop, how to identify a bicycle path – are developed collaboratively and in the open too, in the OpenStreetMap wiki:
With this basic understanding of the mechanics of OpenStreetMap in place, I showed the OpenStreetMap 10th Anniversary visualization video to give them a sense of the scale of the mapping community:
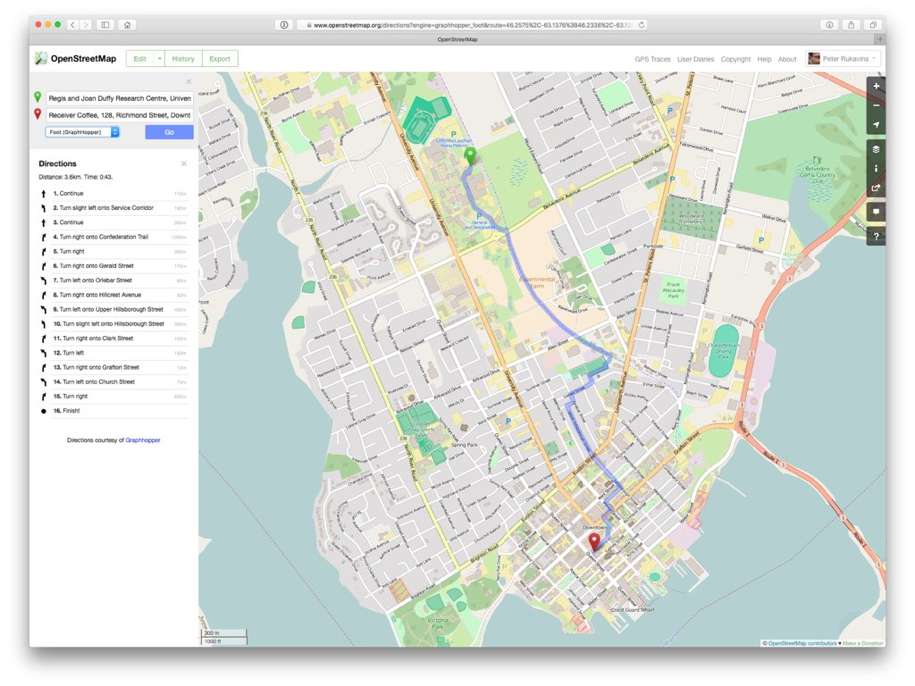
To illustrate that the project isn’t just about making slippy maps for the browser that all look the same, I showed them some examples of different manifestations of OpenStreetMap data, like walking directions:
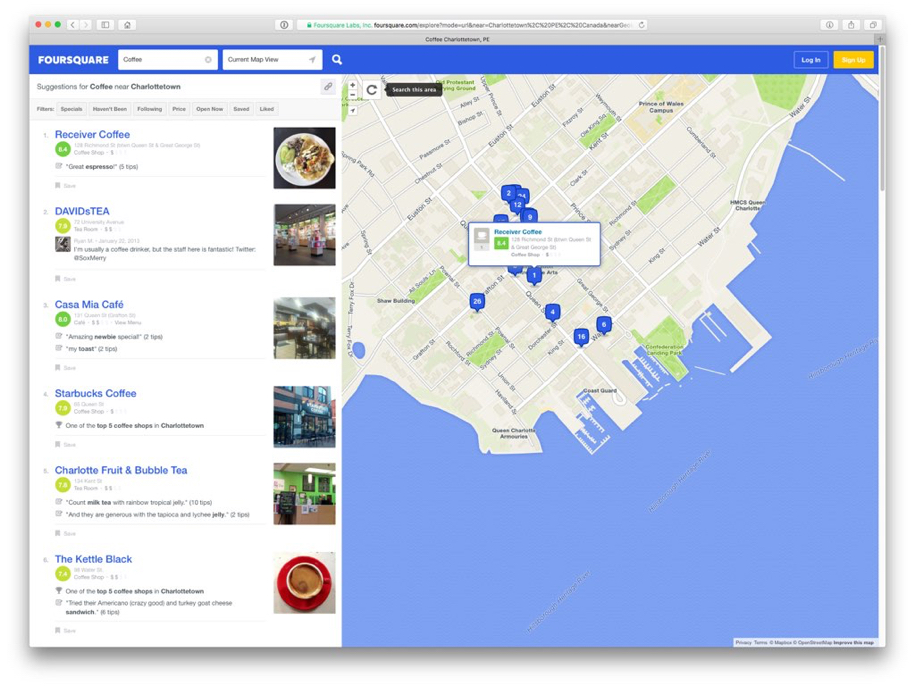
And commercial use of the map data by Foursquare:
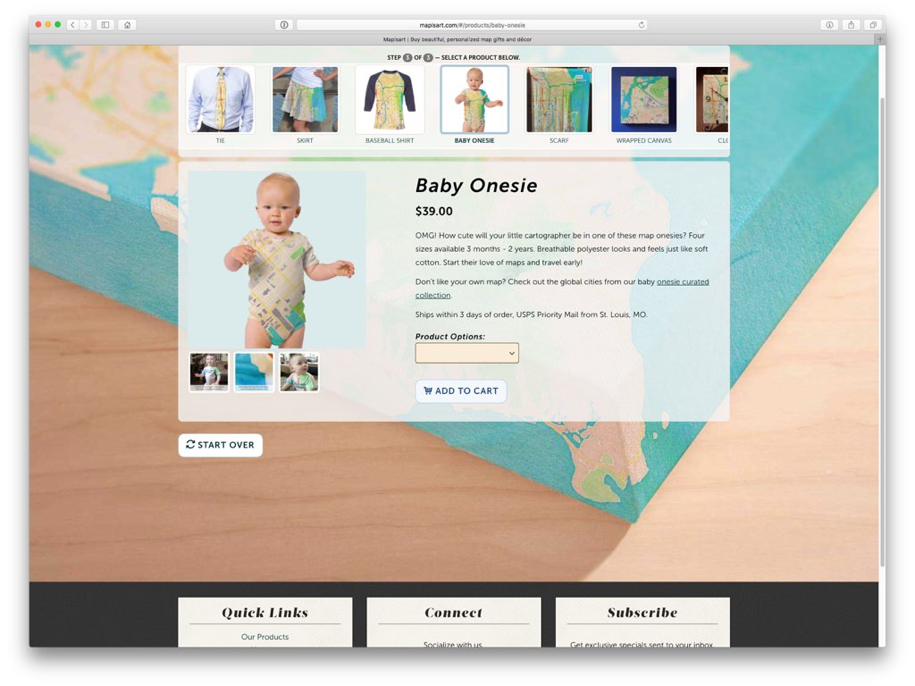
Baby Onesie’s imprinted with the map area of your choice:
And the Humanitarian OpenStreetMap Team:
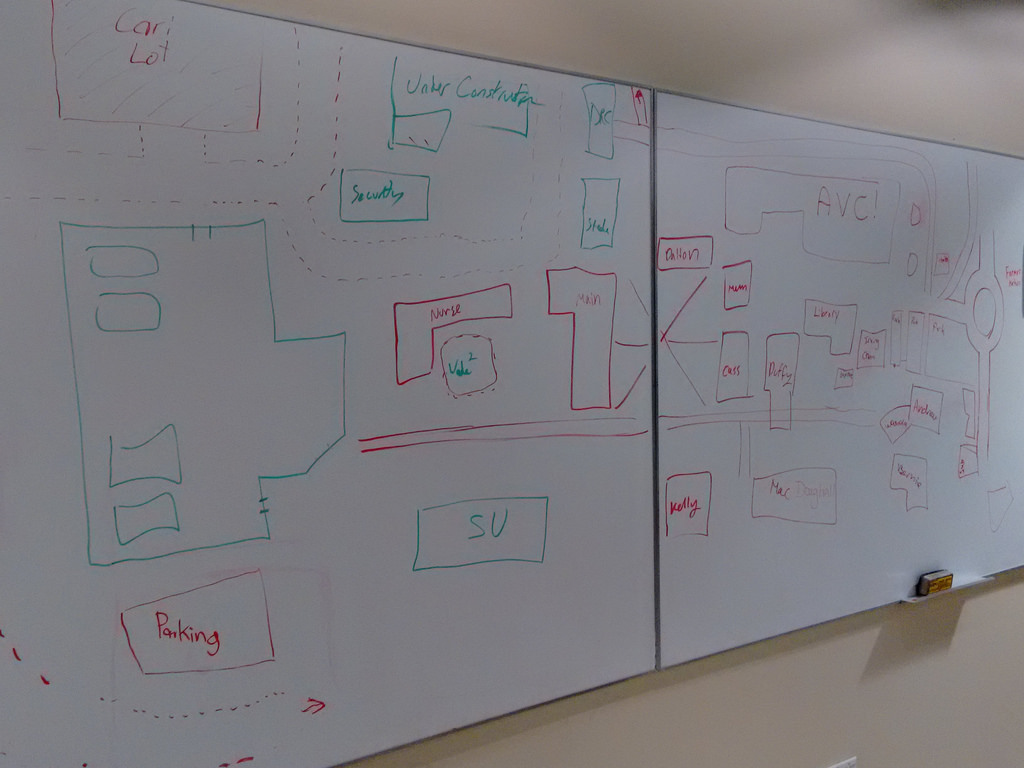
As a final exercise, with all of the above in mind, I asked them to return to the challenge of mapping the University of PEI campus, but this time as a collaborative project, using the whiteboard and the markers I’d given them at the start of the first lecture a week ago:
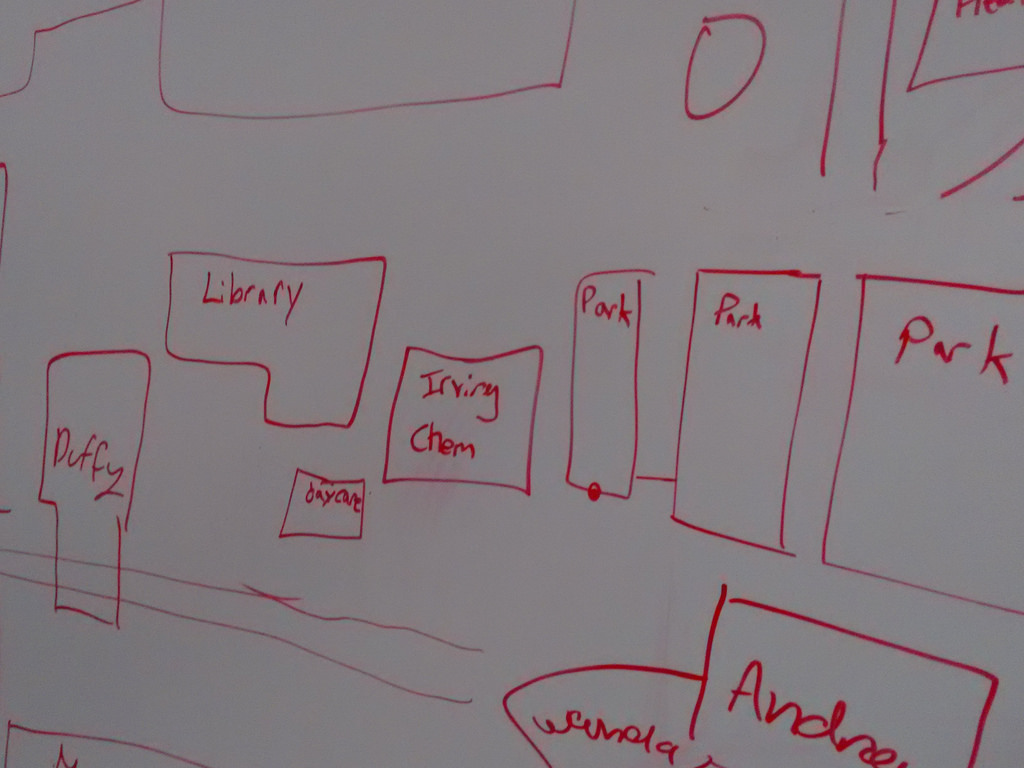
They gamely rose to this challenge:
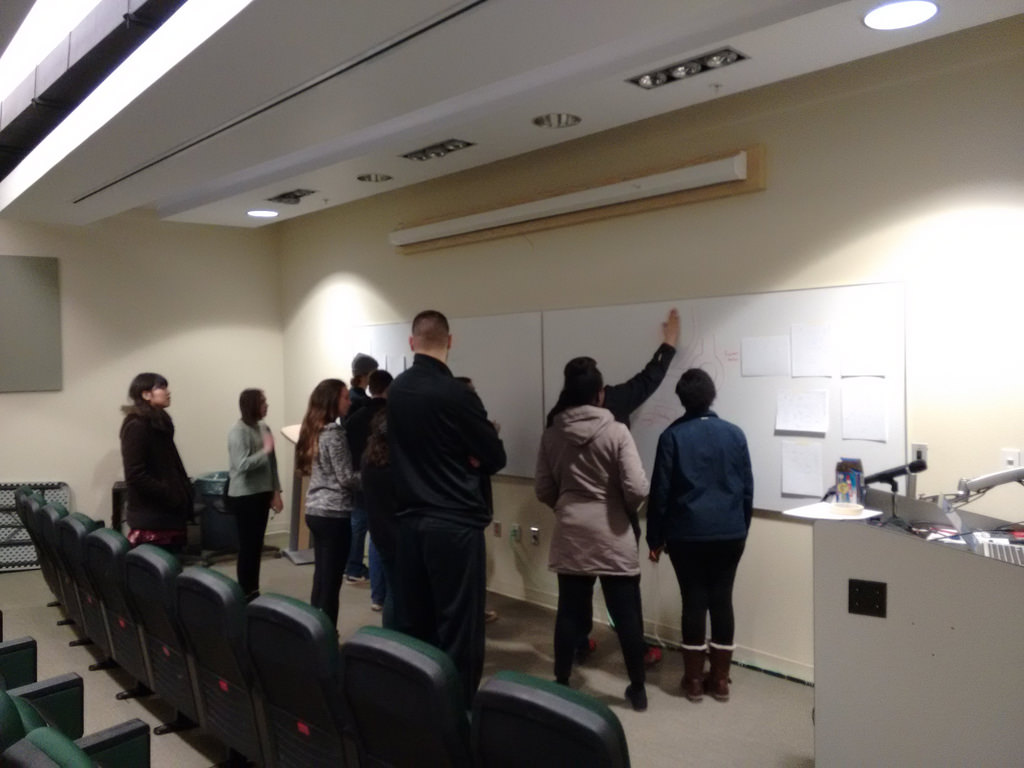
Some students held back – it was a cramped area to work together in, especially for students not used to doing so – but two groups emerged naturally that worked together on opposite ends of the campus. They achieved a surprising amount of detail and accuracy for a 10 minute whiteboard exercise:
As a final effort to knit four lectures and a lot of seemingly disconnected material together, I talked about how what united the notions of “university as a technology,” open data and open mapping was the idea of agency: agency as an actor in their education, agency over developing shared conceptions of the physical world through maps, agency over the data about them and from them that is used to shape policy.
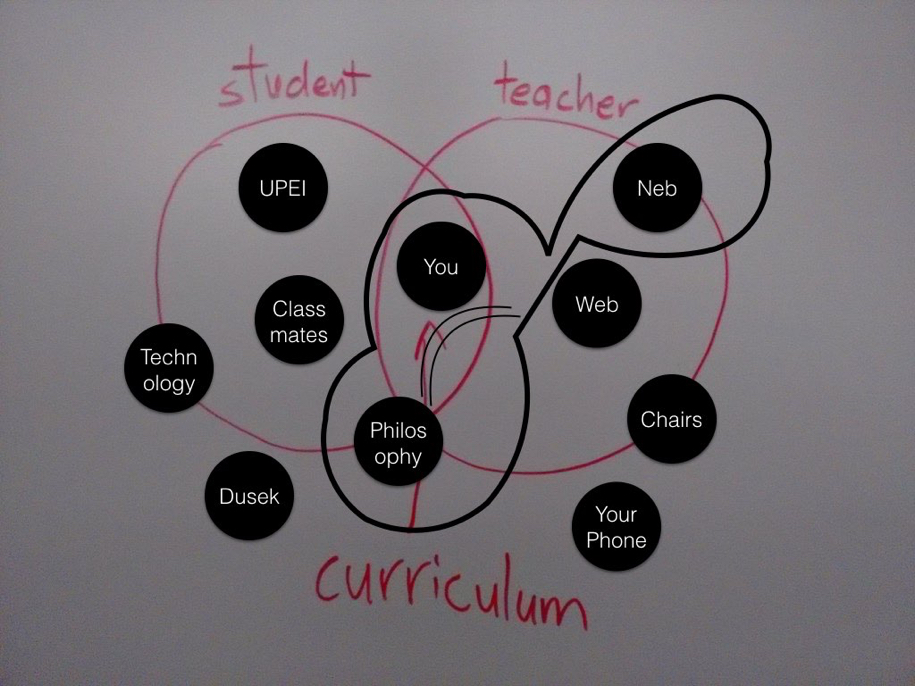
I referred back to the visualization of their own university education to date that I’d asked them to prepare in my first lecture by way of talking about different models – different conceptions of agency – in their education:
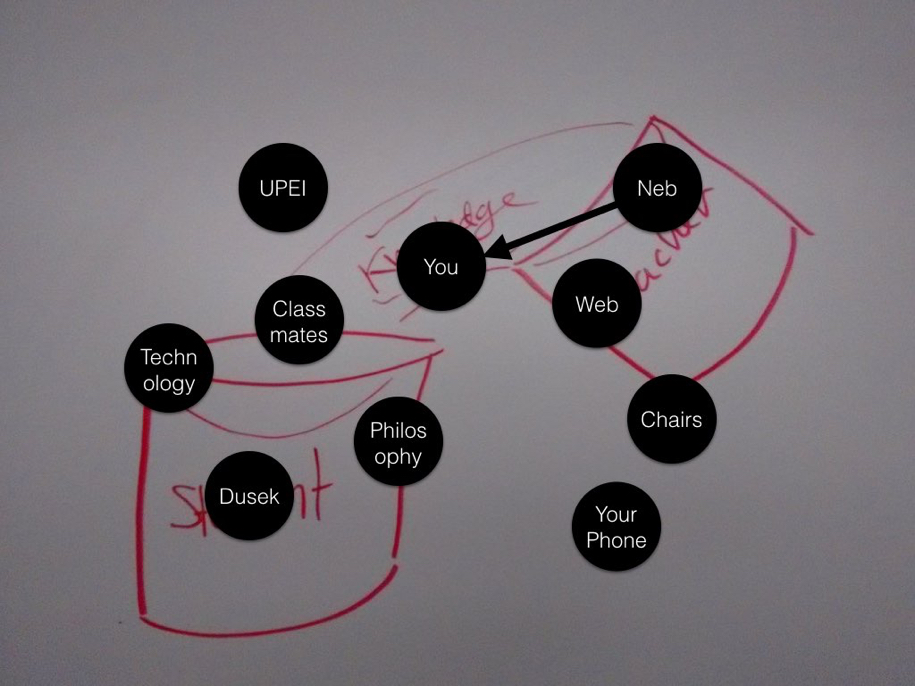
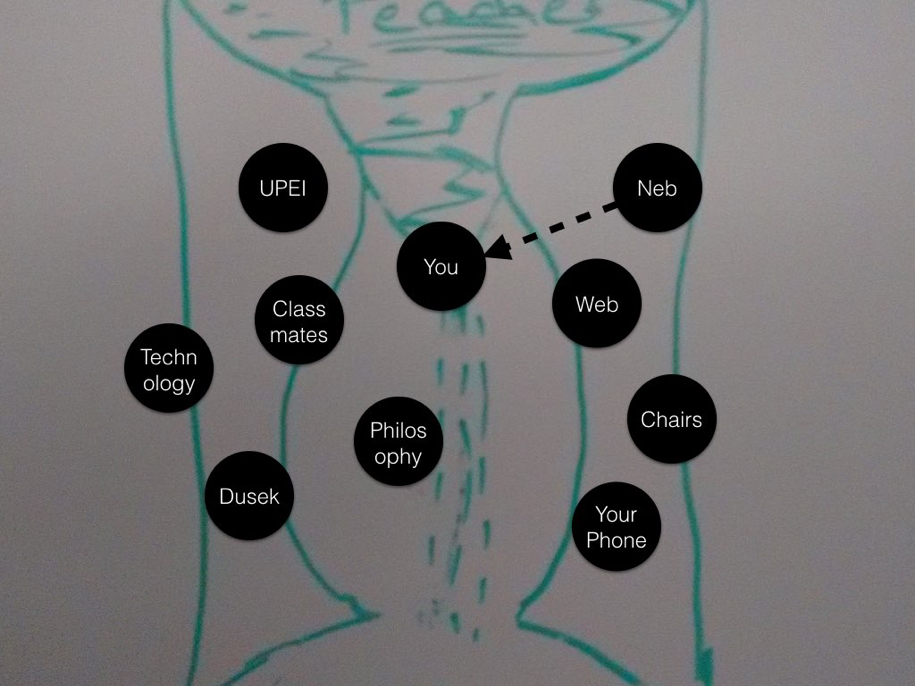
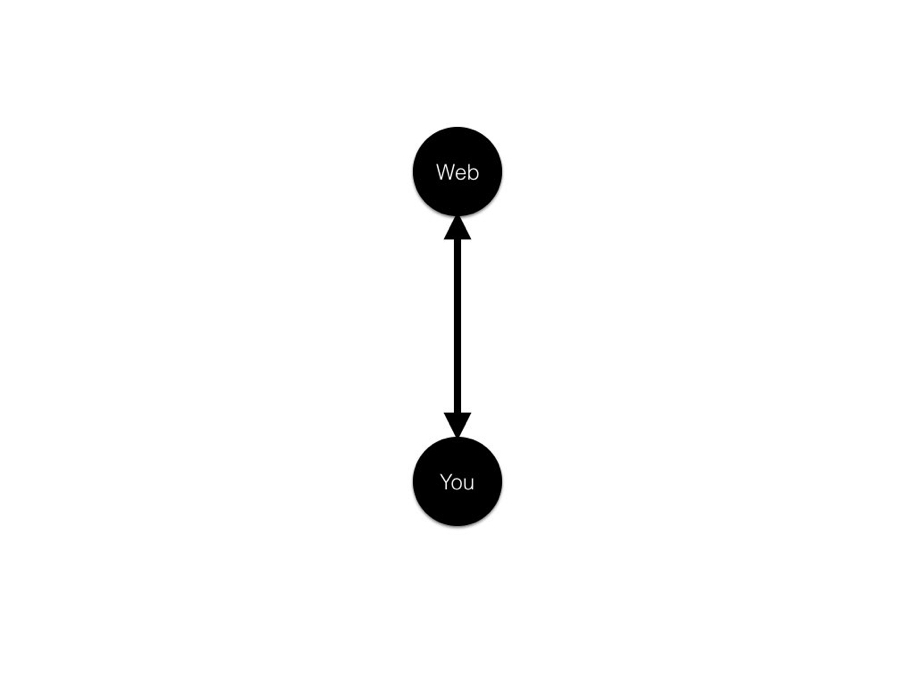
I illustrated several models of the relationship of the individual actor to the web. As a consumer:

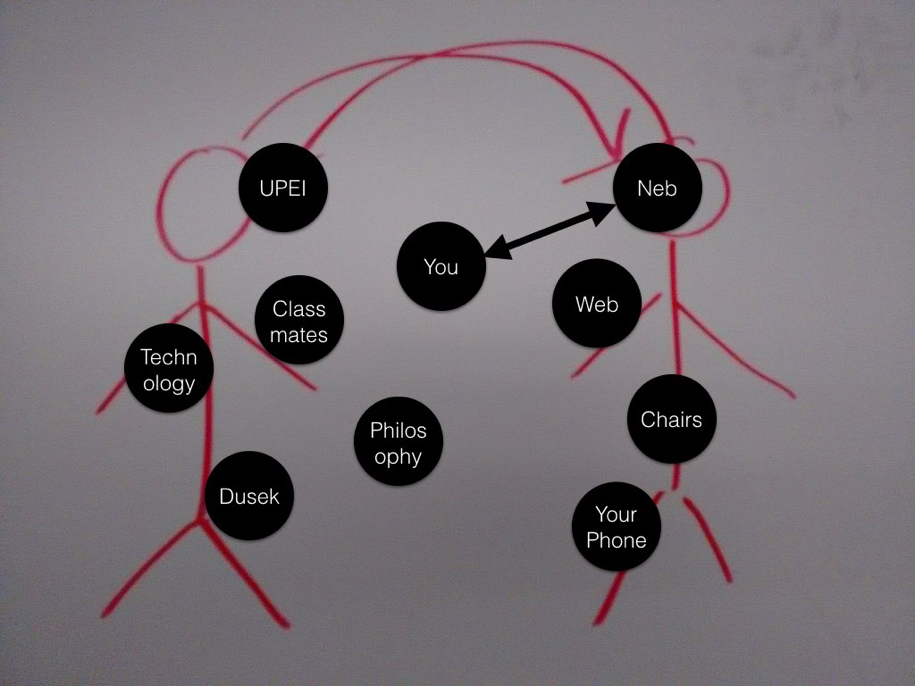
Consumer of and contributor:
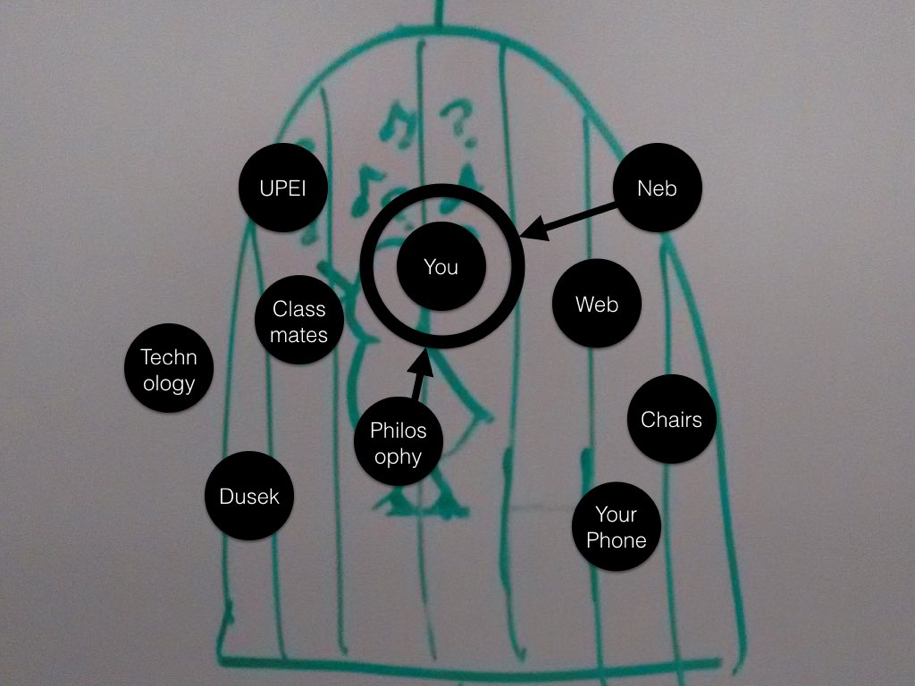
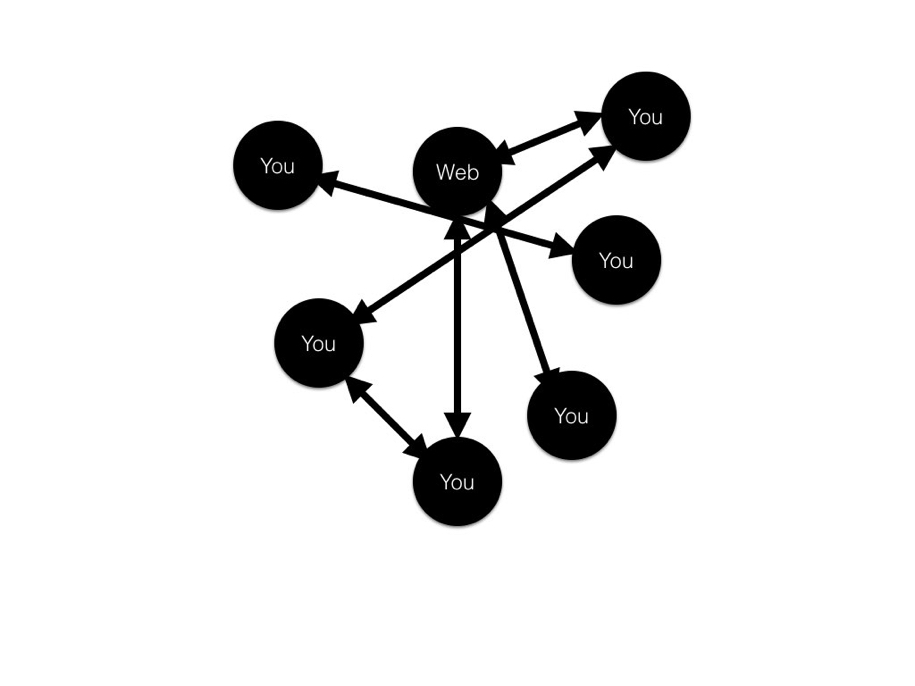
And, perhaps most accurately, consumer of, contributor to, collaborator around, conduit through, as actor in a complex system that they are affecting and that is affecting them:
And with that, we were done.
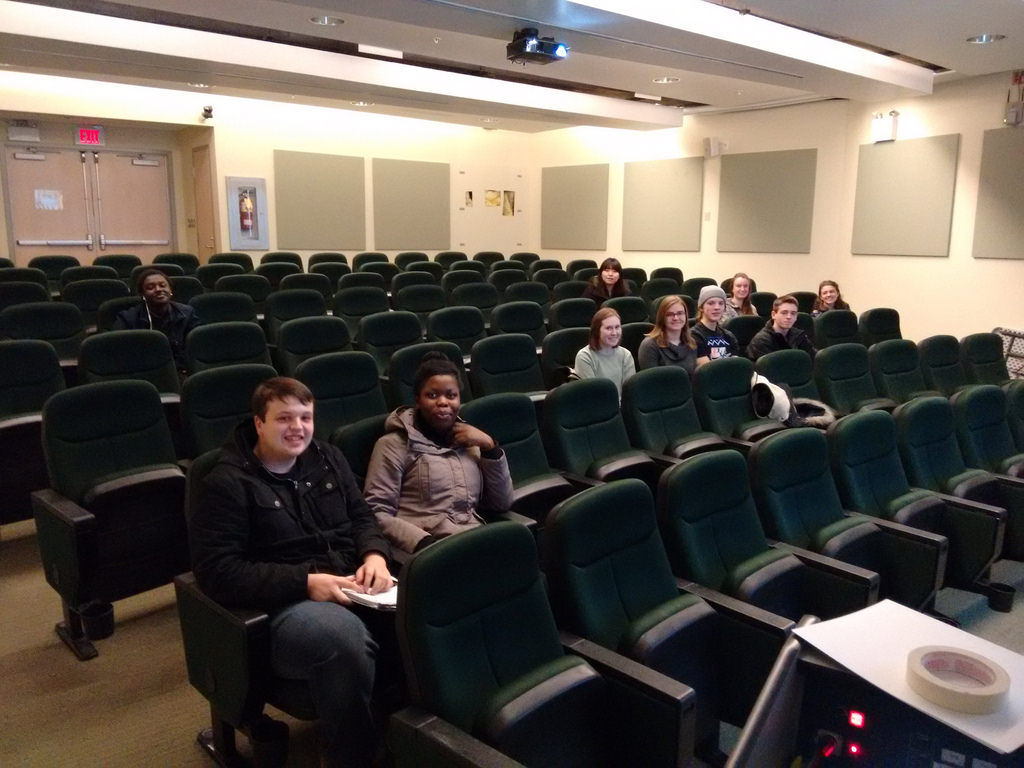
I asked the students if they had any feedback on our time together, and they said I was welcome back, which was about as high a compliment as I can imagine. I asked them for a class picture, and they generously obliged:
I’ll likely have more to write about this experience in a university classroom once I’ve had a chance to ruminate on it for a while. I do come away with both a renewed appreciate for the challenges of the teaching profession but also an awareness that, when a plan comes together and learning is oozing out of the room, there is no better high.
About This Blog
 I am Peter Rukavina and this is my blog. I am a writer, letterpress printer, and a curious person.
To learn more about me, read my /now, look at my bio, listen to audio I’ve posted, read presentations and speeches I’ve written, see things I’ve favourited elsewhere, or get in touch (peter@rukavina.net is the quickest way).
I have been writing here since May 1999: you can explore the 25+ years of blog posts in the archive.
![]() You can subscribe to an RSS feed of posts, an RSS feed of comments, an RSS feed of favourites elsewhere, or a podcast RSS feed that just contains audio posts. You can also receive a daily digests of posts by email. I also publish an OPML blogroll.
You can subscribe to an RSS feed of posts, an RSS feed of comments, an RSS feed of favourites elsewhere, or a podcast RSS feed that just contains audio posts. You can also receive a daily digests of posts by email. I also publish an OPML blogroll.
Instagram • YouTube • Vimeo • ORCID • OpenStreetMap • Internet Archive • PEI.art • Drupal • Github.
Comments
I've been following your blog
I've been following your blog since you read at the poet laureate open mic, and I particularly enjoyed this posting. Thanks.
I'm a geomatics engineer and
I'm a geomatics engineer and I've been working in GIS for the NB Government since 1997. I have also been involved with OpenStreetMap since 2007 when the Maritimes was mostly a blank slate. I've just stumbled across your blog today when I was Googling for PEI Lidar data. That led me to your post about using QGIS to display the PEI contour data that was derived from Lidar. I have read and enjoyed several of your posts today. Thanks.
Add new comment