
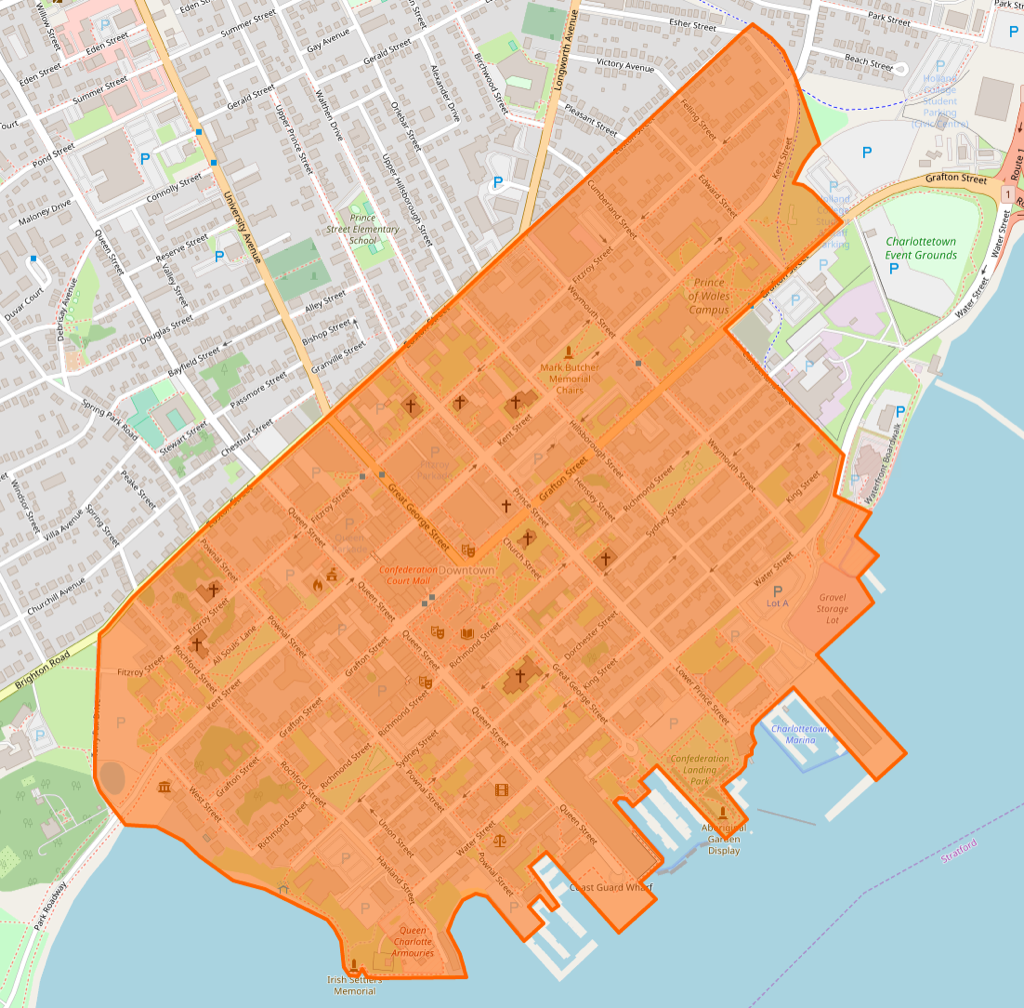
Following on from yesterday’s experiments with visualizing street orientations, I set out to visualize just the streets of Charlottetown’s 500 Lot Area, the historic area at the core of the city, south of Euston Street from Government House to Joe Ghiz Park.
To be able to do that I first needed to create the 500 Lot Area in OpenStreetMap; I used Appendix J of the Charlottetown Zoning and Development Bylaw as my guide, and carefully traced the area as a boundary in the OpenStreetMap Editor; here’s the result:
With the area in OpenStreetMap, I ran the same Python notebook code I ran yesterday, substituting this for the second step:
places = {'500 Lot Area'  : '500 Lot Area, Charlottetown, Canada',
          'Charlottetown'  : 'Charlottetown, PE, Canada'
}
The resulting visualization allows a comparison of Charlottetown as a whole with just the 500 Lot Area:
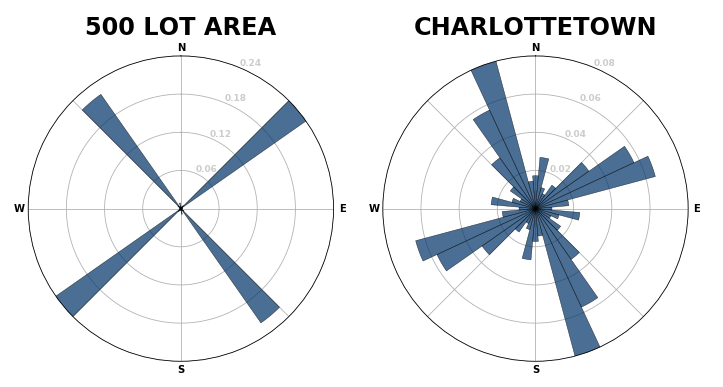
The difference illustrate how strictly orthogonal the historic core of Charlottetown is compared to the rest of the city: the downtown streets run at an angle just shy of 45 degrees from north-south and east-west.
For practical purposes this means that as you walk across the downtown, parallel to the water, you are walking northeast or southwest, and as you walk through the city, up or down between the water and Euston Street, you are walking northwest or southeast.

Comments
Oliver found this great interactive map using the same technique which is far less cumbersome to use.
There’s source code for this, and a helpful walkthru blog post.
Interestingly, the street orientations in Carlisle, Ontario, where I grew up are at almost exactly the same tilt as those in downtown Charlottetown.