
After seeing 8 years of our Netflix streaming activity day-by-day on a calendar, I got curious about what time of day we most often stream, so I used the same raw data I used yesterday to find out.
There’s a date column in the Netflix streaming activity export that looks like this:
1526177708874
1526169219659
1525735831181
1525130481740
1525043053677
1525040614148
1524960752757
1523330480349
1523145136457
1523142542204
1523142413550
1523064942413
1523058300622
That doesn’t look much like a human-readable date, mind you: that’s because it’s a numeric representation of a date, a timestamp that represents numerically the time since January 1, 1970.
Take 1526177708874, for example: if I divide that by 1,000 I get 1526177708, and if I feed that value to DuckDuckGo, which has a handy “convert a Unix timestamp to a date” featurelette, I get Sun May 13 02:15:08 2018 UTC. Which is, indeed, the time I watched the Catalina episode of the TV show Love.
What I really need for my purposes here isn’t specific dates, though: I want the hour of the day. So I paste that date column into a text file, and then load it into a spreadsheet and convert each value to a date with the formula:
=(A2/1000)/86400+date(1970,1,1)
which gives me a new column of dates, which I can format as a time:
1526177708874	02:15
1526169219659	23:53
1525735831181	23:30
1525130481740	23:21
1525043053677	23:04
1525040614148	22:23
1524960752757	00:12
1523330480349	03:21
Those values, though, are UTC times, not local times, so I need to take one more step, and do a blunt force time zone conversion (with no accounting for daylight time):
=B2-4/24
Now I have a third column, with the local time we streamed each episode:
1526177708874	02:15	22:15
1526169219659	23:53	19:53
1525735831181	23:30	19:30
1525130481740	23:21	19:21
1525043053677	23:04	19:04
1525040614148	22:23	18:23
1524960752757	00:12	20:12
1523330480349	03:21	23:21
I copy that column’s contents into a text file, times.txt, and use a text editor and a regular expression search-and-replace to end up with just the hour part of those times.
22
19
19
19
19
18
20
23
With just the hours in times.txt now, I use trusty uniq and awk to prepare a histogram-ready count of streams watch by the hour:
sort times.txt | uniq -c | awk '{ print $2 "," $1}' > histogram.csv
The result is a list of each hour of the day along with the number of Netflix streams we started during that hour, from 2010 to yesterday:
01,1
05,5
06,30
07,61
08,80
09,62
10,50
11,55
12,62
13,74
14,54
15,68
16,125
17,266
18,267
19,357
20,361
21,367
22,242
23,54
I import that into a spreadsheet and create a bar chart to visualize it:
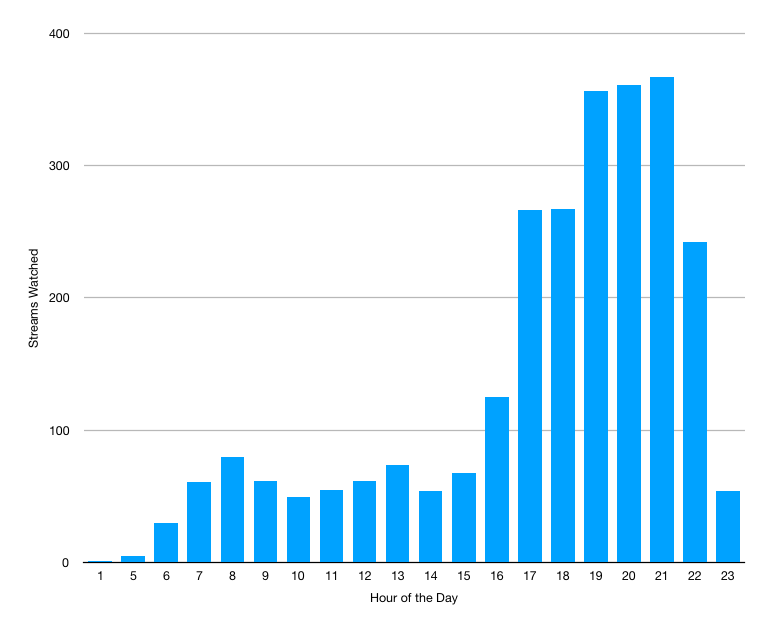
The result maps to my expectations: we mostly watch Netflix in the evening, with the peak activity at 9:00 p.m., which is around the time Oliver’s traditionally gone to bed. We never stream between 1:00 a.m. and 5:00 a.m., and even then I suspect that the early morning streams are either time zone shifts when we watch Netflix while traveling.
About This Blog
 I am Peter Rukavina and this is my blog. I am a writer, letterpress printer, and a curious person.
To learn more about me, read my /now, look at my bio, listen to audio I’ve posted, read presentations and speeches I’ve written, see things I’ve favourited elsewhere, or get in touch (peter@rukavina.net is the quickest way).
I have been writing here since May 1999: you can explore the 25+ years of blog posts in the archive.
![]() You can subscribe to an RSS feed of posts, an RSS feed of comments, an RSS feed of favourites elsewhere, or a podcast RSS feed that just contains audio posts. You can also receive a daily digests of posts by email. I also publish an OPML blogroll.
You can subscribe to an RSS feed of posts, an RSS feed of comments, an RSS feed of favourites elsewhere, or a podcast RSS feed that just contains audio posts. You can also receive a daily digests of posts by email. I also publish an OPML blogroll.
Instagram • YouTube • Vimeo • ORCID • OpenStreetMap • Internet Archive • PEI.art • Drupal • Github.
Add new comment