
Given that I was born on one side of Lake Ontario and grew up on the other side, you might say I have the Great Lakes in my blood.
And even more so because my father, a nearshore sedimentologist, was engaged in a survey of the Great Lakes over much of my childhood, and so my strongest childhood memories are camping on the shores of one of the lakes or another, usually in a provincial park, while my father was “in the field.”
This might explain why I find this visualization of the International Great Lakes Datum so compelling:
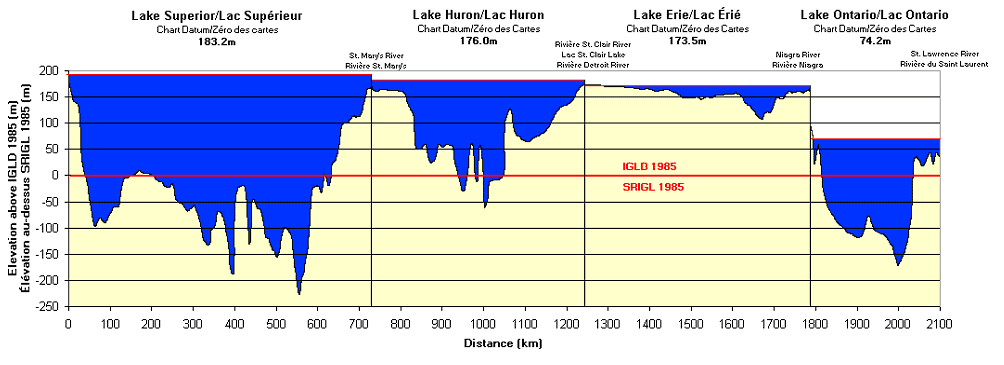
The visualization shows the Great Lakes from Lake Superior (where my father, and before him his mother, were born in Fort William) through Lake Huron and Lake Erie and Lake Ontario to the St. Lawrence River (from which I get my middle name).
The depths shown are from the the 1985 International Great Lakes Datum, which is a set of depths that, as explained here, establish a reference point from which to measure:
For navigational safety, depths on a chart are shown from a low-water surface or a low-water datum called chart datum. Chart datum is selected so that the water level will seldom fall below it and only rarely will there be less depth available than what is portrayed on the chart.
In other words, if you’re going to measure the depth of something, you need a commonly-held understanding of where “zero” us. That’s this.
Beyond visualizing a technical system for measurement, the graphic also illustrates wonderfully how deep Lake Superior is, how shallow Lake Erie is, and why there is Niagara Falls (between Lake Erie and Lake Ontario).
If you want a primer on the Great Lakes, there is no better one than The Rise and Fall of the Great Lakes, the 1968 Bill Mason film.
About This Blog
 I am Peter Rukavina and this is my blog. I am a writer, letterpress printer, and a curious person.
To learn more about me, read my /now, look at my bio, listen to audio I’ve posted, read presentations and speeches I’ve written, see things I’ve favourited elsewhere, or get in touch (peter@rukavina.net is the quickest way).
I have been writing here since May 1999: you can explore the 25+ years of blog posts in the archive.
![]() You can subscribe to an RSS feed of posts, an RSS feed of comments, an RSS feed of favourites elsewhere, or a podcast RSS feed that just contains audio posts. You can also receive a daily digests of posts by email. I also publish an OPML blogroll.
You can subscribe to an RSS feed of posts, an RSS feed of comments, an RSS feed of favourites elsewhere, or a podcast RSS feed that just contains audio posts. You can also receive a daily digests of posts by email. I also publish an OPML blogroll.
Instagram • YouTube • Vimeo • ORCID • OpenStreetMap • Internet Archive • PEI.art • Drupal • Github.
Comments
In other words, if you’re
In other words, if you’re going to measure the depth of something, you need a commonly-held understanding of where the reference “zero” is. That’s this.
Add new comment