
So remember yesterday when I was chickening out of asking Premier MacLauchlan for a ride up to Summerside? Well my chickening out was genuine, but what I didn’t factor in, somewhat naively, is that the Premier would find out about my chickening out and offer me a ride anyway.
Which, of course, this being Prince Edward Island and all, he did.
Last night while [[Oliver]] and I were out at the John Cousins, Catherine answered the phone at home; the caller inquired as to whether I had a ride to Summerside or not, and when Catherine said she didn’t know, the caller left their name and number and asked her to have me to call them back when I got in. The caller was Premier MacLauchlan.
Which makes it doubly important that I have a deeper understanding of Prince Edward Island’s Gross Fixed Capital Formation because, you gotta know that, with the way things are going, the Premier is actually going to ask me about it.
I first became aware of the very notion of Gross Fixed Capital Formation only yesterday, while reading the province’s Annual Statistical Review (a document that should be on the bedside of every Islander). Here’s what it says in the economic overview for 2012-2013 (emphasis mine):
Growth between 2012 and 2013 was largely the result of a 4.5 per cent increase in exports. Final domestic demand increased 1.8 per cent, while household consumption expenditures increased 1.6 per cent. Government gross fixed capital formation increased by 3.7 per cent. Imports increased by 1.8 per cent. Real gross domestic product growth was revised up for 2011 to 1.6 per cent and revised down for 2012 to 1.0 per cent.
In regular peacetime reading, I would translate this, roughly, as “blah blah blah, blah blah, blah.”
But these are not regular times. I needed help.
Who better to ask about what all this means, and why we measure it, than the province’s Director of Economics, Statistics and Federal Fiscal Relations, Nigel Burns, an estimable man to whom I’ve addressed similar questions in the past and always received a thorough and helpful answer.
So I called Nigel up. And here’s what I learned.
The summary that appears in the overview I quote above (“increased by 3.7 per cent”) uses numbers from a Statistics Canada-provided table that appears on page 53 of the Annual Statistical Review titled “Real Provincial Gross Domestic Product, 2009-2013 (Millions of Chained (2007) Dollars) Prince Edward Island”. Here’s the table, with the “Government gross fixed capital formation” highlighted:
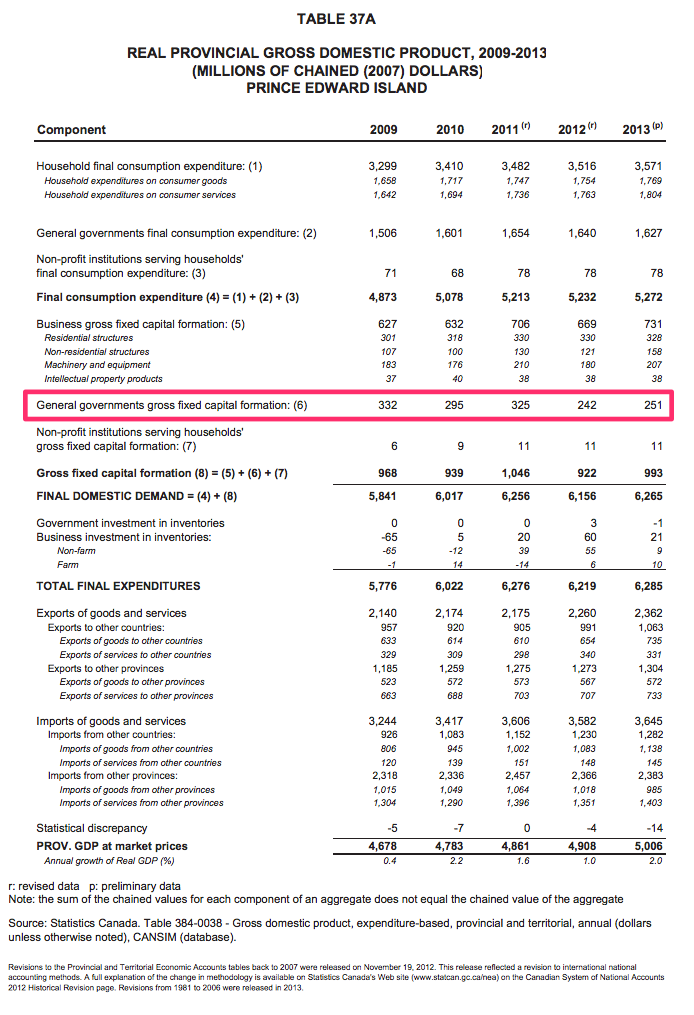
The “3.7 per cent increase” referenced in the overview is the increase of $242 million in 2012 to $251 million in 2013 in the last two columns of the highlighted row above.
Breaking this down, with Nigel’s help, here’s what this means.
This table reports on the Real Gross Domestic Product of the province (often referenced as “the GDP”); this, Statistics Canada says, is a report of the “total value of the goods and services produced” in the province. You calculate it by adding up everything spent on stuff (roads, laundry detergent, schools, olive oil) and adding this to the difference between exports and imports.
So in 2013, for example, we spent $6,285 million on stuff; add this to the difference between exports and imports of -$1,283 million and you get a GDP of $5,006 million.
In rougher numbers: $6.3 billion spent, minus $1.3 billion in import/export difference, equals $5 billion in GDP.
The Gross Fixed Capital Formation part of this is the portion of the “stuff” that is fixed: roads, houses, schools, buildings, bulldozers, photocopiers, hammers (as opposed to, say, cable TV, mayonnaise, and toothpicks).
And the Government Gross Fixed Capital Formation is the portion of that which is spent by governments (federal, provincial and municipal).
So, in other words, in 2013 the federal, provincial and municipal government on Prince Edward Island spend a combined $251 million on “fixed stuff.” They built schools. Bought snowplows. Built a wharf. Dug some ditches. Add it all up and it cost them a quarter billion dollars.
As it happens, the “Millions of Chained (2007) Dollars” part of the table means that governments didn’t actually spend $251 million on fixed stuff in 2013 on Prince Edward Island, they spent $251 million in 2007 dollars on fixed stuff in 2013. Converting the numbers to 2007 dollars removes inflation from the numbers, and allows apples-to-apples comparisons to be made.
I asked Nigel why we’d measure government gross fixed capital formation at all — what does it tell is, from a policy-making perspective? — and he told me that, in part, it gives us an indication of the involvement of governments in the economy. If, for example, there was a 20% decrease in government gross fixed capital formation from one year to the next, this would tell us, in essence, “wow, governments really pulled back on investments in infrastructure last year.”
And as a component of the GDP it allows us to see what role government spending on fixed stuff plays in the larger shape of the economy.
As it happens, most of the macroeconomic things you hear the Premier and his ministers talking about are packed into that table.
For example, last October the Premier gave an address to the Summerside Chamber of Commerce where he reported, in part:
My second observation on the trade front brings us close to home. Prince Edward Island has a balance-of-trade deficit that hobbles our economy. Simply put, we buy more than we sell. On an annual basis, we spend $1.3 billion more in purchases from outside the province than we generate in receipts from out-of-province sales. While we can be deservedly proud of our expanding export story, our province will not be geared for sustainable growth unless we can shrink that balance-of-trade deficit. It currently represents more than 20% of our total GDP.
The story he told in that paragraph is also told in the GDP table: the “exports of goods and services” number is $2.3 billion and the “imports of goods and services” number is $3.6 billion. So we’re importing $1.3 billion more than we’re exporting.
Or when the Minister of Education, Early Learning and Culture said, in the Legislative Assembly, on April 14, 2016:
The next area of my responsibility, and something that I’m becoming very interested in and learning a tremendous amount, is the area of culture. The culture sector contributes $121 million to our local GDP.
That’s $121 million that appears in various places in the “expenditures” section of the table — theatre tickets, musical instrument purchases, and so on. It seems like a lot, but when you take $121 million as a proportion of the total provincial expenditures of $6,265 million, it turns out to be only 1%. An important 1%, of course – the soul of the province, you might say – but only 1% nonetheless. And if you’re trying to move the GDP, perhaps not where you’d put a huge amount of emphasis if you want to make big gains. Which is both important to understand, and also important, as a way of thinking, to confront.
Peter Bevan-Baker, Leader of the Third Party, released a briefing document when he introduced the Well-being Measurement Act in the Legislative Assembly last fall that nicely summed up the need to confront this:
- Traditional methods of determining progress such as Gross Domestic Product and Gross National Product measure production and consumption.
- These systems do not measure the effects of production and consumption on society, the economy and the environment. They do not measure quality of life of a place, or the wellbeing of its people.
- By using only economic measurements like GDP, Prince Edward Island remains at risk of failing to meet the needs of its residents, struggling to develop a sustainable economy, and not being able to meet the environmental challenges that are ahead.
Which is to say, I think, that it’s all very well and good to increase the GDP, but what if increasing the GDP decreases the qualities of some of the things in our lives that we value? At the very least, shouldn’t we measure those things so that we can understand the rise and fall of the GDP in a more human, day to day context?
I’m intrigued by that notion.
And also embarrassed to find that, after hearing the term GDP batted about in the media for 50 years, it wasn’t until today that I opted to find out what it really means.
So, that’s a lot to talk about on the car ride to Summerside now, isn’t it.
About This Blog
 I am Peter Rukavina and this is my blog. I am a writer, letterpress printer, and a curious person.
To learn more about me, read my /now, look at my bio, listen to audio I’ve posted, read presentations and speeches I’ve written, or get in touch (peter@rukavina.net is the quickest way).
I have been writing here since May 1999: you can explore the 25+ years of blog posts in the archive.
You can subscribe to an RSS feed of posts, an RSS feed of comments, or a podcast RSS feed that just contains audio posts. You can also receive a daily digests of posts by email.
Comments
It seems like consumption is
It seems like consumption is called product(ion)? What's that about?
Add new comment