Node-RED is, like IFTTT and Yahoo! Pipes, a visual tool that lets you plug things together to create workflows. What sets Node-RED apart is that it’s specifically designed to enable workflows that reach into the physical “Internet of Things” world: data flowing in on a serial port, for example, or the state of GPIO pins.
It’s also something best illustrated by example, so here’s a walkthrough of how I created a display for the water meter in my office at The Guild in downtown Charlottetown.
To construct the water meter I used the following hardware:
- Grid Insight AMRUSB-1, a USB dongle that reads meters via radio and outputs messages that can be read on a serial port.
- Stock Raspberry Pi model B.
- PiTFT, a 2.8 inch touchscreen display.
- USB wifi dongle to connect to the Internet.
Here’s what the Node-RED workflow I created looks like when it’s done:
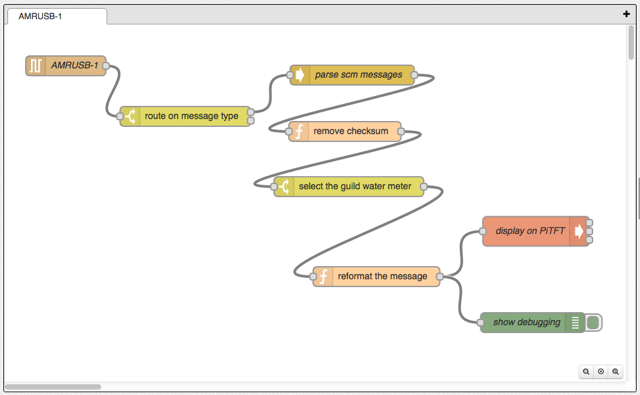
Each of the nodes in the workflow does something – reads data, processes data, outputs data, and so on – and they are wired together in a way that routes that data from node to node. Double-clicking on any node shows its details.
Read Data from the AMRUSB-1
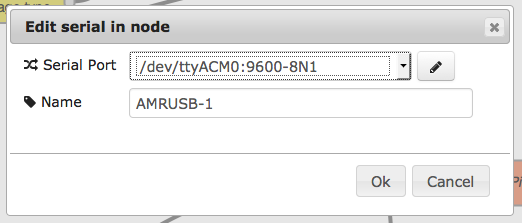
The first node reads data from the AMRUSB-1 on the /dev/ttyACM0 device, 9600 baud, 8 bits, no parity, 1 stop bit:
The details of the serial port setup look like this:
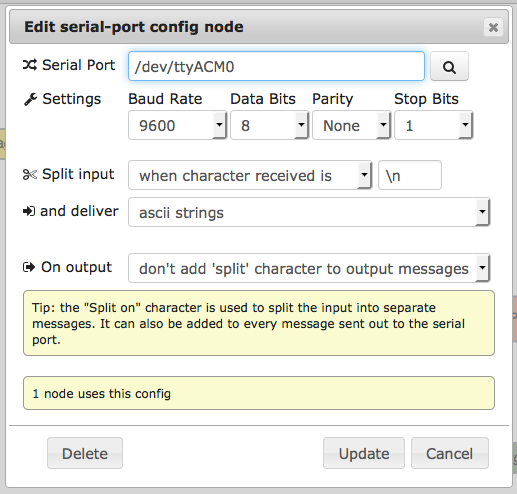
This is set up to send one Node-RED message for every line that’s received from the device (lines end with “\n”).
Route by Message Type
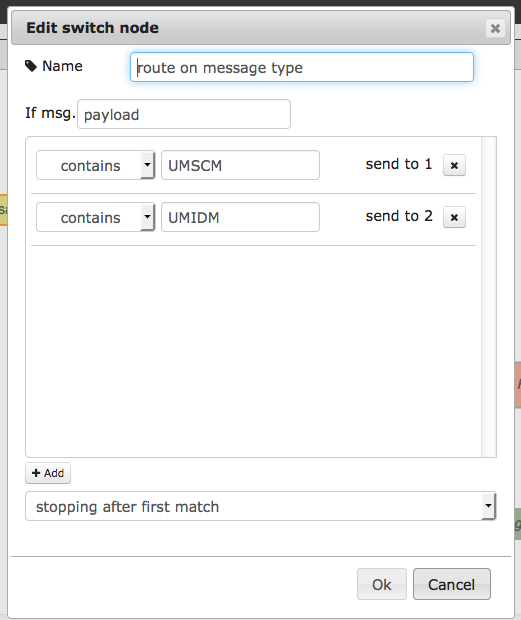
The AMRUSB-1 received two types of meter reading messages, SCM and IDM. We’re only interested in the SCM messages, so we use a “switch” node to split the workflow into two based on whether UMSCM or UMIDM is found in the message:
Parse the SCM Messages
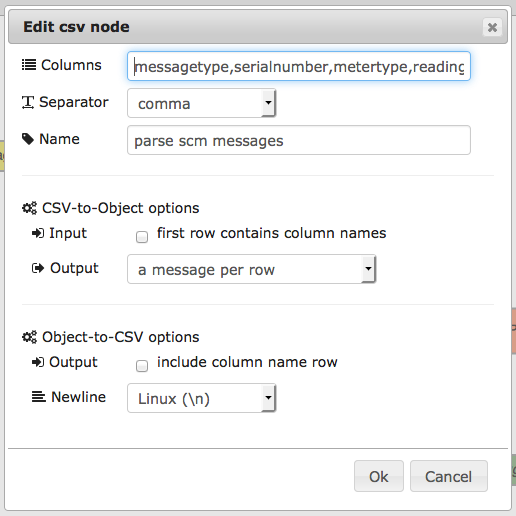
Each SCM message is a comma-separated set of values: the message type, the meter serial number, the meter type, and the meter reading; using a “csv” node, we split these into individual values:
Remove the Checksum from the Reading
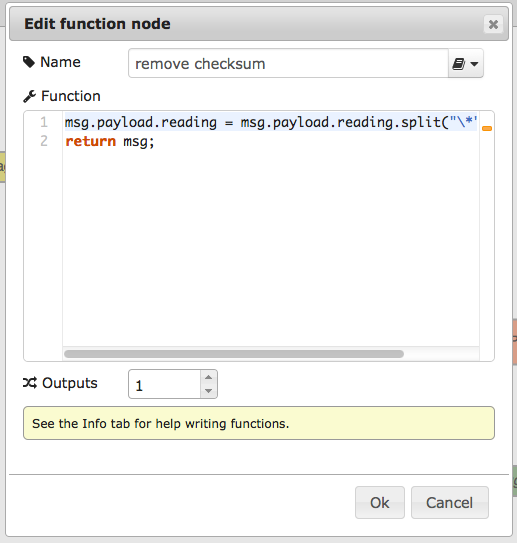
The final CSV value, “reading,” has a checksum value appended to it, beginning with an asterisk; we need to remove this, so we use a “function” node containing a simple line of JavaScript:
msg.payload.reading = msg.payload.reading.split("\*", 1)[0];
return msg;
msg.payload.reading = msg.payload.reading.split("\*", 1)[0];
return msg;
Select only The Guild Water Meter
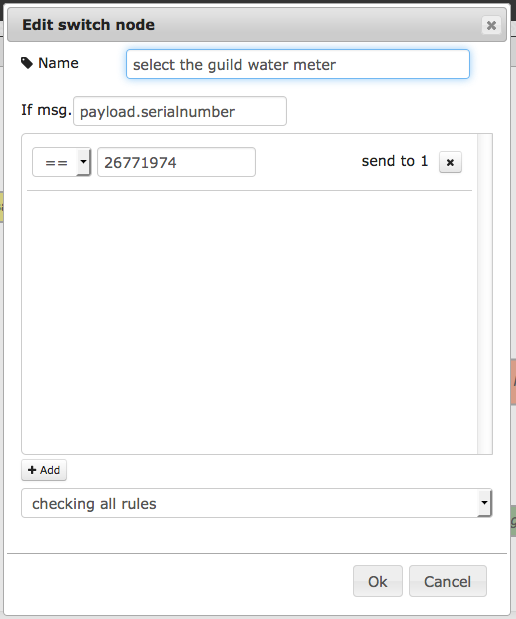
Looking at the actual water meter in the basement of The Guild, I found it has a serial number of 26771974; because I only want data for that single meter (the AMRUSB-1 will read any meter in the area), I use a “switch” node to filter for that serial number only:
Reformat the Message for Display
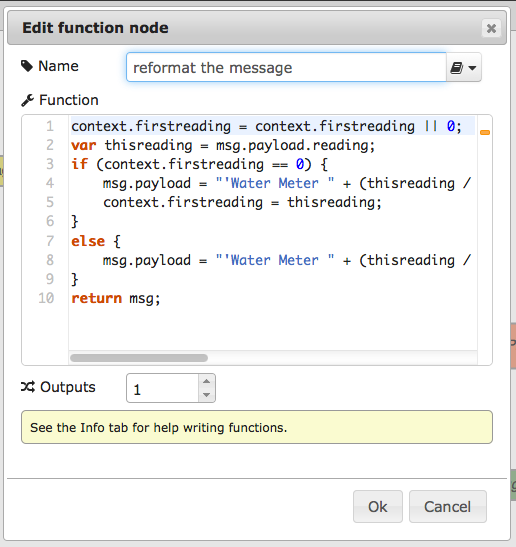
We want to display the message on an external display in the format Water Meter X m3 (Y m3 today) where X is the absolute value of the meter, and Y is the difference from the first reading taken. We use another “function” node to do this, using JavaScript to do the heavy lifting:
context.firstreading = context.firstreading || 0;
var thisreading = msg.payload.reading;
if (context.firstreading == 0) {
    msg.payload = "'Water Meter " + (thisreading / 10) + " m3'";
    context.firstreading = thisreading;
}
else {
    msg.payload = "'Water Meter " + (thisreading / 10) +
      " m3 (" + ((thisreading - context.firstreading) / 10) +
      " m3 today)'";
}
return msg;
Display the Message
Now that we have the message, we want to display it on the PiTFT display connected to the Raspberry Pi. To do this we use an “exec” node to call a shell script on the Pi, display-on-pitft.sh, that displays the message using the fbtext utility to draw into the framebuffer:
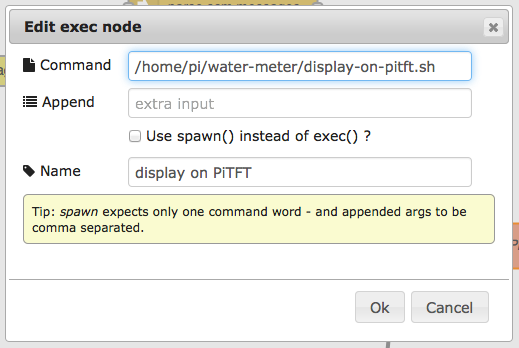
The shell script looks like this:
#!/bin/sh

pkill -9 -f fbtext
echo "$1" | /home/pi/fbtext/fbtext -d /dev/fb1 -i Inconsolata-38.bdf -
To start, I kill off any previously-running instances of fbtext; this means that processes don’t build up and keep running everything I update the display.
The $1 is the text of the message coming from Node-RED, fbtext is the executable (compiled from source obtained from here with guidance from here), /dev/fb1 is the PiTFT display framebuffer, Inconsolata-38.bdf is a bitmap font that I created from the Inconsolata OpenType using FontForge and the final dash says “read the text from the standard input rather than from the filename that I would otherwise specific here.”
Display Debugging
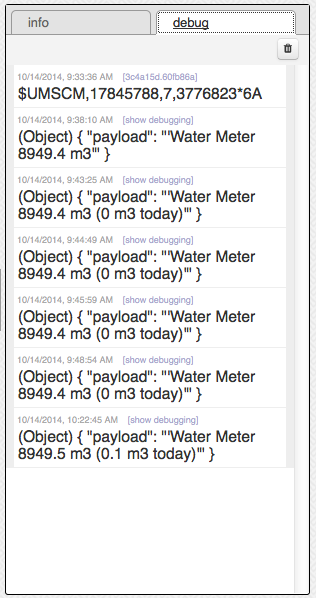
Messages can be routed to multiple nodes; to double-check what I’m sending to the display, I use a “debug” node to show the same message in the debug tab of Node-RED; it looks like this when the workflow is running:
Up and Running
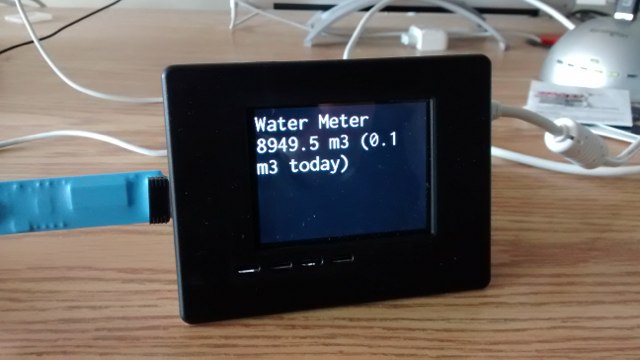
Once I deploy the workflow in Node-RED, it starts listening for AMRUSB-1 messages; when it receives one, the messages are parsed and reformatted and then end up on the display of the Raspberry Pi:
To Do
The “today” measurement isn’t really “today’s” usage, it’s the usage since the workflow started to run; I’d like this to be smarter.
I’d like Node-RED to auto-start when the Raspberry Pi boots; that way I won’t have to start the workflow running from my Mac via a browser as I do now.
And it would be nice to have the display be more information rich, with a larger typeface for the meter-reading and perhaps some graphical representation of the measure.
 I am
I am
Add new comment