
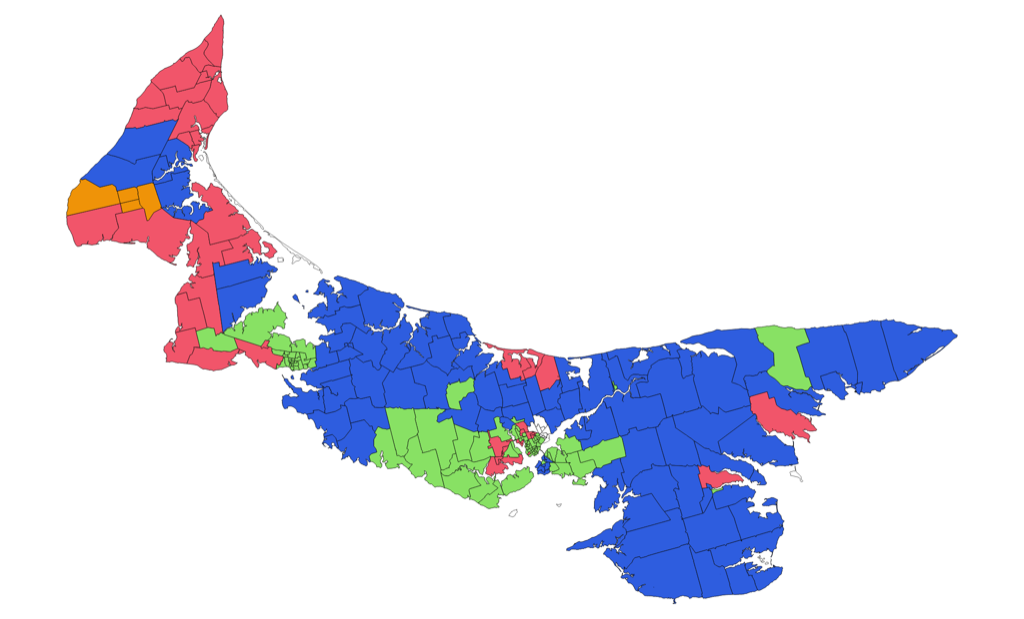
Elections PEI published results of yesterday’s provincial general election as a collection of HTML tables, which are not well-suited when you’re looking for machine-readable data to do interesting things with. Things like this visualization of the winners of each poll:
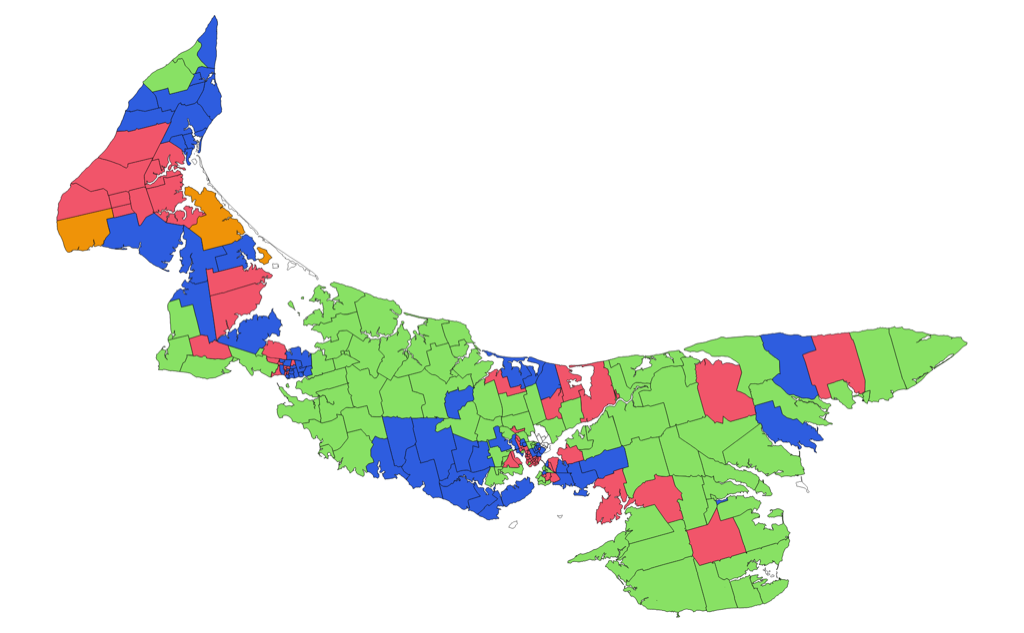
Or this visualization of the party that came second place in every poll:
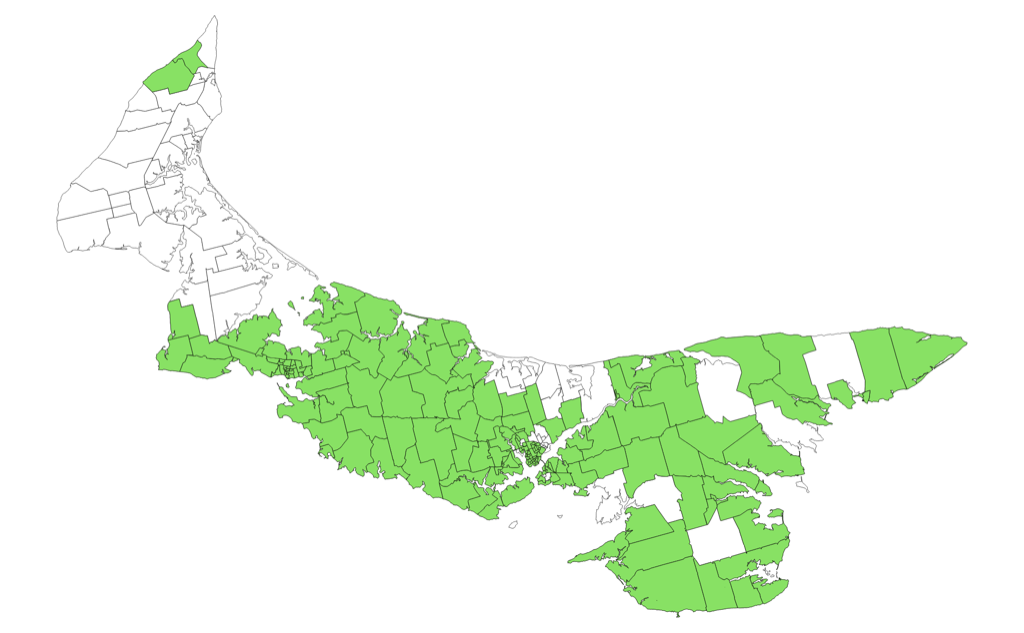
Or this visualization of polls where Green candidates came first or second:
Fortunately, HTML tables are sort of machine-readable to start, and it doesn’t table much to parse them and turn them into something even more machine-readable.
So this morning I wrote some code to do exactly that, and you can download it and take it for a ride or, if you’re just looking for the data itself you can grab one of two files:
- pei-election-results.json is a JSON file of all of the results for each district of each poll.
- pei-election-poll-winners.csv is a CSV file of only the winners of each poll.
It’s that “winners” file that I used to create the visualization above, which you can explore in an interactive version that I’ve just published to the QGIS Cloud.
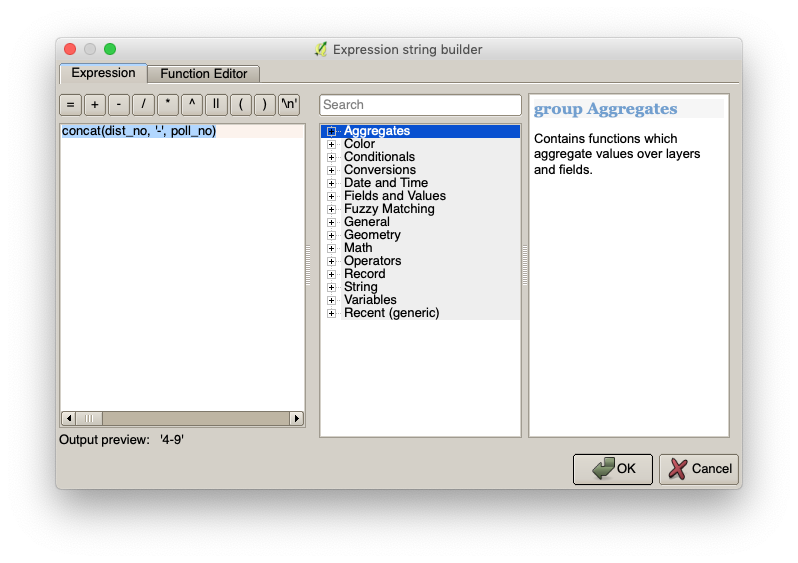
I combined the CSV file with the Electoral Districts GIS layer. To be able to do this I first needed to create “virtual field” called “distpoll” in the Electoral Districts layer:
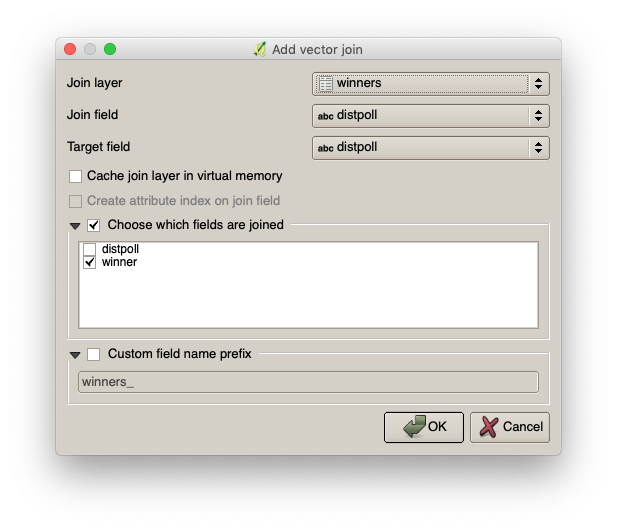
With that virtual field in place, I could join the winners CSV file to the Electoral Districts layer, using the “distpoll” field for the join:
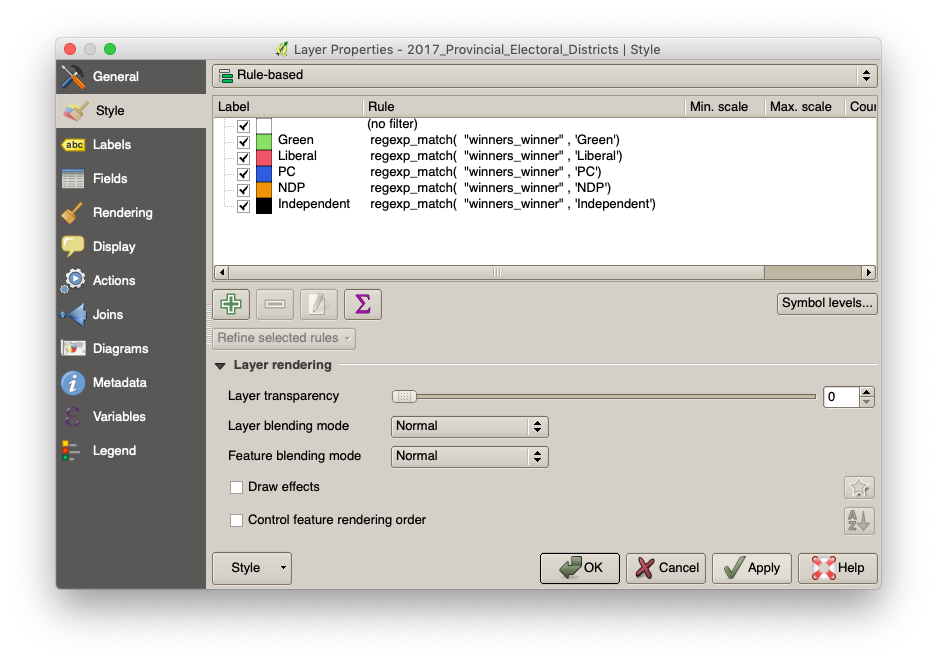
And with the files joined, I used “rule-based” styles in QGIS to colour-code each poll by the winner (leaving those polls with no winner–those in District 9 in this case, where the election was delayed–white):
I’m hopeful that others can build on this code to make additional interesting things from the results.
About This Blog
 I am Peter Rukavina and this is my blog. I am a writer, letterpress printer, and a curious person.
To learn more about me, read my /now, look at my bio, listen to audio I’ve posted, read presentations and speeches I’ve written, see things I’ve favourited elsewhere, or get in touch (peter@rukavina.net is the quickest way).
I have been writing here since May 1999: you can explore the 25+ years of blog posts in the archive.
![]() You can subscribe to an RSS feed of posts, an RSS feed of comments, an RSS feed of favourites elsewhere, or a podcast RSS feed that just contains audio posts. You can also receive a daily digests of posts by email. I also publish an OPML blogroll.
You can subscribe to an RSS feed of posts, an RSS feed of comments, an RSS feed of favourites elsewhere, or a podcast RSS feed that just contains audio posts. You can also receive a daily digests of posts by email. I also publish an OPML blogroll.
Instagram • YouTube • Vimeo • ORCID • OpenStreetMap • Internet Archive • PEI.art • Drupal • Github.
Comments
How do you account for the
How do you account for the advance polls? Greens lost 22 or 23 of the advance polls, which is represented by each polling area. Can you do a map by advance polls as well?
Unfortunately advance poll
Unfortunately advance poll count is published on a district-by-district level (despite all of the voters in the advance polls having “home” polls that they’re attached to by their civic address).
So it’s only be possible to produce advance polls results maps on a district level, not a poll level. Here’s what it looks like:
This map is deceptive because it includes polling division boundaries — the province hasn’t yet released a GIS layer that includes only district boundaries (and trying to combined the polling division polygons in QGIS to produce district polygons leaves some annoying leftover bits).
Which is to say that what’s represented on this map are “what districts did each party win the advance poll in”. It’s not a poll-level visualization.
Hey Peter, found this post
Hey Peter, found this post searching for PEI GIS electoral boundaries. I've been trying to combine the 2017 poll polygons in QGIS to having a district map, it's driving me mad. Happy to read I am not the only one having this problem.
Add new comment