 Our regular little Formosa Tea House lunch group shared a table today with Jim Lea, President & Chief Executive Officer of Maritime Electric. We’d been talking a lot about energy lately, and we invited Jim to lunch to help fill in some of the gaps in our knowledge.
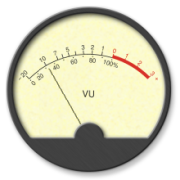
One of the interesting things I learned is that Maritime Electric can, without a lot of difficulty, provide information about the current Island-wide demand for electricity at any given time. I call this “the big VU meter,” and we encouraged Jim to look into adding a “live” reading on their website.
Thinking about this more this afternoon, it occured to me that in addition to this, it might make sense to provide the same information in machine-readable form, perhaps as an RSS feed, or in an alternative XML format.
Why?
Because then others could build energy-saving applications built on this information.
If I could always grab the current electricity demand number over the web from Maritime Electric, I could, for example, write an application that would turn my clothes dryer on or off depending on current conditions. Or I could automaticaly turn the air conditioner down in the server room. Or automatically turn off my Christmas lights.
Not everyone is going to do this, and there’s probably more “neato” potential than practical energy savings to be derived, at least right now. But the general principle — a utility freely sharing information, in an open format, using the Internet — has a lot of potential because it moves us from a model where we’re all working in isolation to a model where we’re working as an interdependent, symbiotic system.
 I am
I am
Comments
Here is an example of what
Here is an example of what you are proposing in place for Ontario: http://www.theimo.com/imoweb/m…
This is a really great idea
This is a really great idea Peter. I have heard of something like this on a local TV news show. With the metre on at peak dinner time the announcer asked to see if the community could lower the load - the metre dropped in seconds.
If we had such a metre we could get a sense of what was happening. It’s all a mystery right now. As a first step it would raise consciousness.
During the summer of ‘03 you
During the summer of ‘03 you could watch that load demand figure on the Ontario website respond to public demand like that…but apparently the transmission line operators in Ohio were not so attentive and pop! went the lights.
Yes, geeks love all sorts of
Yes, geeks love all sorts of metering and charting and graphing of data. I’m sure we could think up all sorts of cool ideas.
P.S. So when can we expect another “Live from the Formosa Tea House” recording?
Add new comment