We’ve now had a water meter at our house at 100 Prince Street for more than two years.
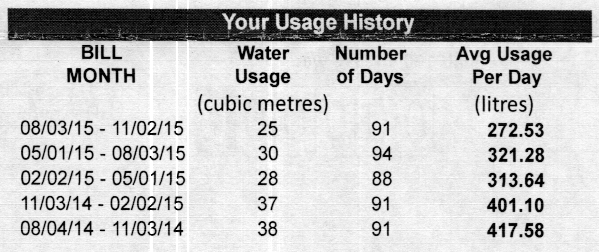
We started monitoring our daily water usage, as part of the Social Consumption Project, in late October 2014; in the quarter previous to that our daily usage was 417.58 litres, which was up almost 100 litres per day from when the meter was installed in late 2013.
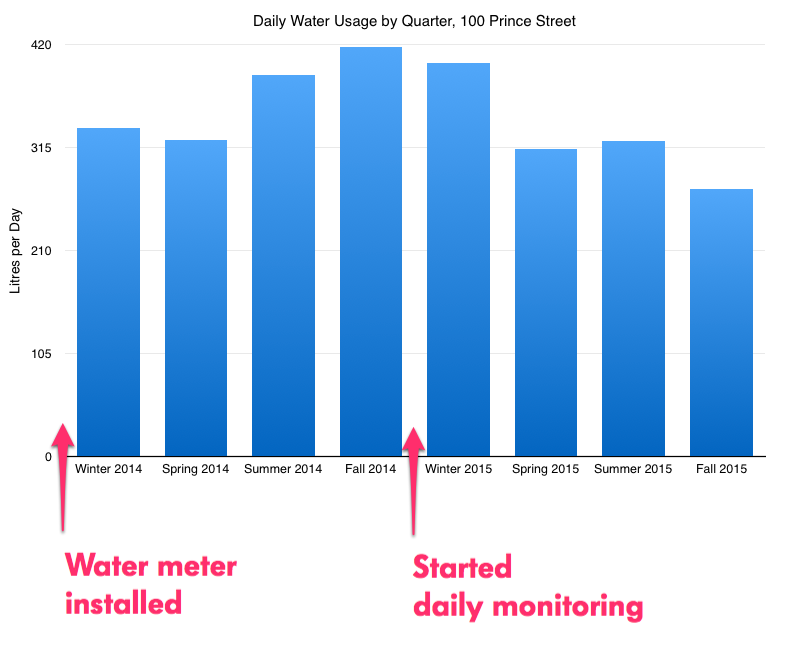
Almost every quarter since that our consumption has decreased; in the most recent quarter it was 272.53 litres per day, down 35% from where we started in the fall of 2014:

On a chart our daily consumption from the winter of 2014 to the fall of 2015 looks like this:

I think we can attribute at least some of the 35% decrease to the fact that we were monitoring our usage daily: not necessarily because we were carefully monitoring every drop, but because it made us pay more peripheral attention to our consumption, and more likely to not run the tap when brushing our teeth, to use the rain barrel to water the garden, to have showers instead of baths.
My next step is to talk to our Social Consumption Project fellow households and see what their experiences have been.
If you want to follow along, here’s a web app that shows our daily consumption of water and electricity, along with our partner households, in real time.
 I am
I am
Add new comment