
I’ve been archiving Prince Edward Island electricity load and generation data for more than 2 years now, but to date the only way of visualizing that data was a confusing graph. A graph that loads really slowly – or not at all – on mobile devices. And so I found my “peripheral aggregate electricity awareness” sinking.
So in an effort to scratch this itch, I coded up a small single-purpose mobile-friendly website yesterday, http://pei.consuming.ca/, that looks like this:
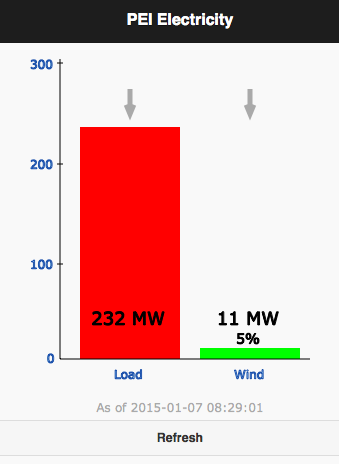
The website tells you three things: what the total electricity load on Prince Edward Island is right now (“how much electricity we’re all using”), how much of that load is being met by wind-energy generation, and what percentage of the load the wind represents.
In the screen shot above, taken this morning at 8:30 a.m., the load is high at 232 MW (peak load on PEI is 268 MW) and only a small fraction of that load, 11 MW or 5%, is being met by the wind (the remainder is coming from local fossil fuel generation and over the submarine cable from New Brunswick). Both the load and the wind were lower than the last report, which is why the light grey arrows are both point downward.
You should be able to load up http://pei.consuming.ca/ in any relatively modern mobile or desktop browser: the chart is drawn with jCanvas and the site uses the jQuery Mobile framework.
About This Blog
 I am Peter Rukavina and this is my blog. I am a writer, letterpress printer, and a curious person.
To learn more about me, read my /now, look at my bio, listen to audio I’ve posted, read presentations and speeches I’ve written, see things I’ve favourited elsewhere, or get in touch (peter@rukavina.net is the quickest way).
I have been writing here since May 1999: you can explore the 25+ years of blog posts in the archive.
![]() You can subscribe to an RSS feed of posts, an RSS feed of comments, an RSS feed of favourites elsewhere, or a podcast RSS feed that just contains audio posts. You can also receive a daily digests of posts by email. I also publish an OPML blogroll.
You can subscribe to an RSS feed of posts, an RSS feed of comments, an RSS feed of favourites elsewhere, or a podcast RSS feed that just contains audio posts. You can also receive a daily digests of posts by email. I also publish an OPML blogroll.
Instagram • YouTube • Vimeo • ORCID • OpenStreetMap • Internet Archive • PEI.art • Drupal • Github.
Add new comment