
I had the pleasure of speaking at the Annual Meeting of Engineers PEI today in Charlottetown, with a talk I called The Government That Swallowed a Pond (Using Open Data and GIS to Inform Policy and Influence Behaviour).
I used the opportunity to expand on my August talk at the Applied Geospatial Research in Public Policy Workshop, Where PEI Public Servants Live and Work (and can we get them to leave their cars at home?); since I prepared the data for that talk I’ve received additional data from the Province of PEI on the home and work locations of government workers (up from 4,519 people to 13,211 — it turns out that if you ask for “each employee of the PEI public service, across all departments and agencies” you don’t actually get everyone; I had to submit three additional access requests). I’ve also explored additional capabilities of QGIS, especially its ability to bulk-calculate driving directions using Openrouteservice.
And I added some images of lovely postcards of Government Pond collected by the late Boyde Beck:
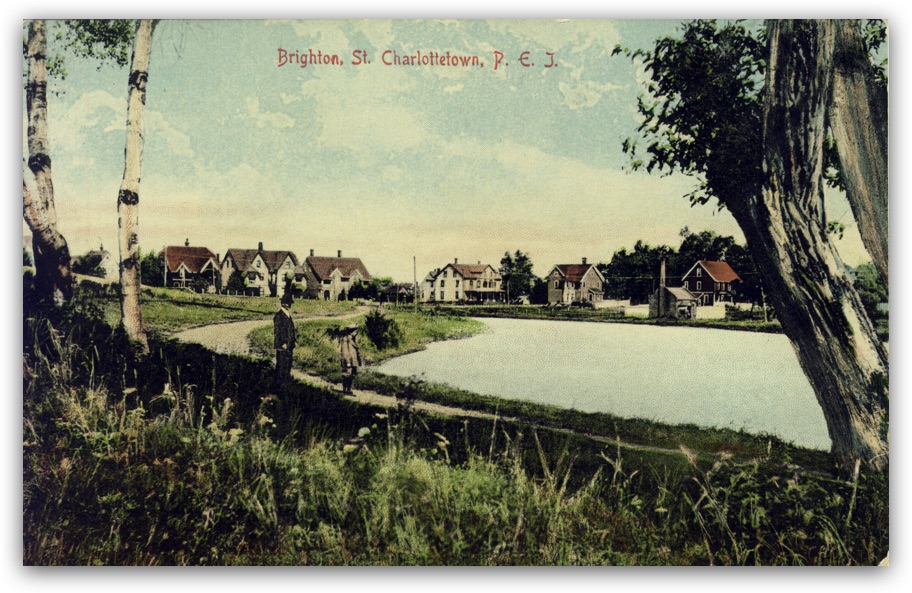
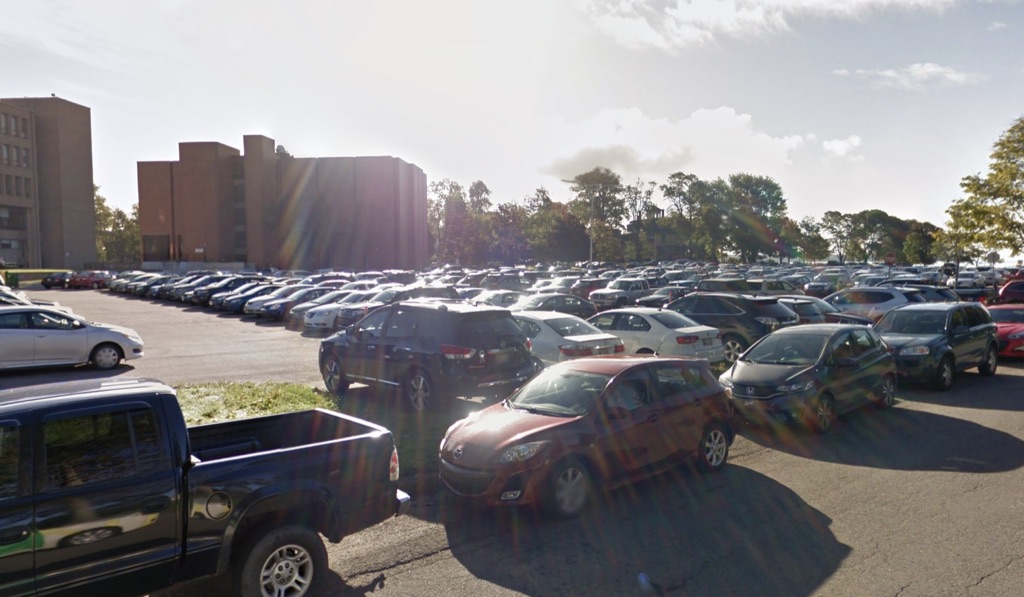
Images that look a lot different from the view of Government Pond one sees today:
Fortuitously, two days ago I received an email from a member of Bike Friendly Charlottetown asking if I might have data that could bolster their case for building the active transportation lane across the Hillsborough Bridge that the previous government committed to. Always ready to do just-in-time research, I dug in yesterday, and the result was an additional act in my talk on that very topic.
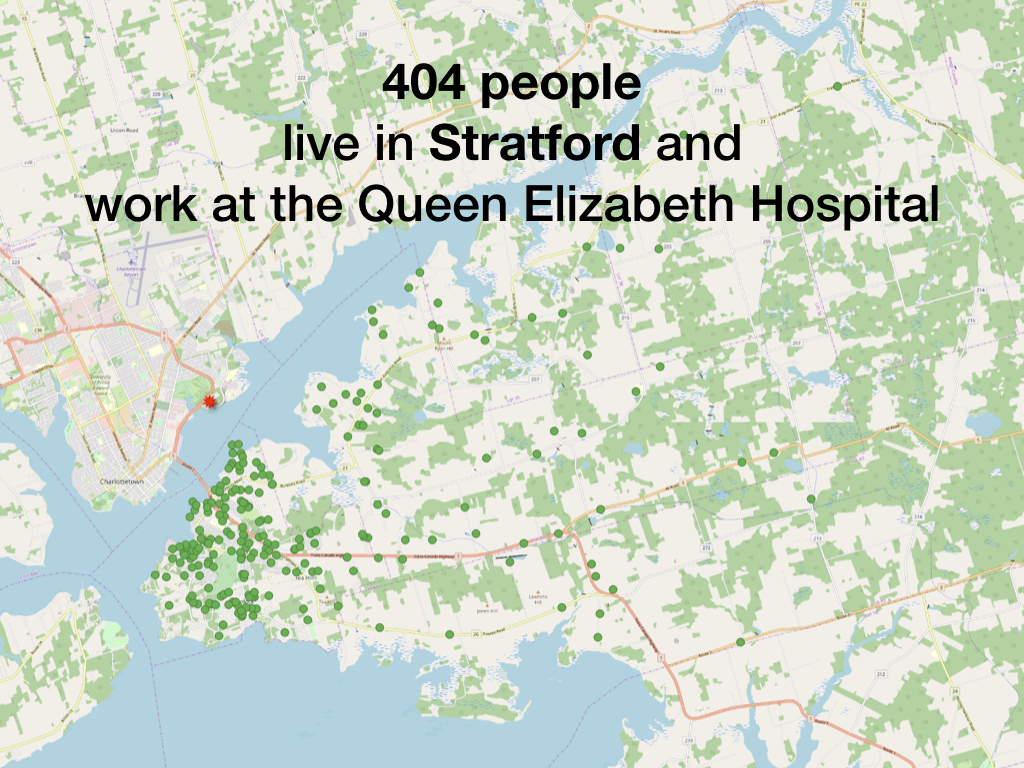
First, I plotted the home postal codes of the 404 people who live in Stratford and work at Queen Elizabeth Hospital (the largest public employer of people who live in Stratford):
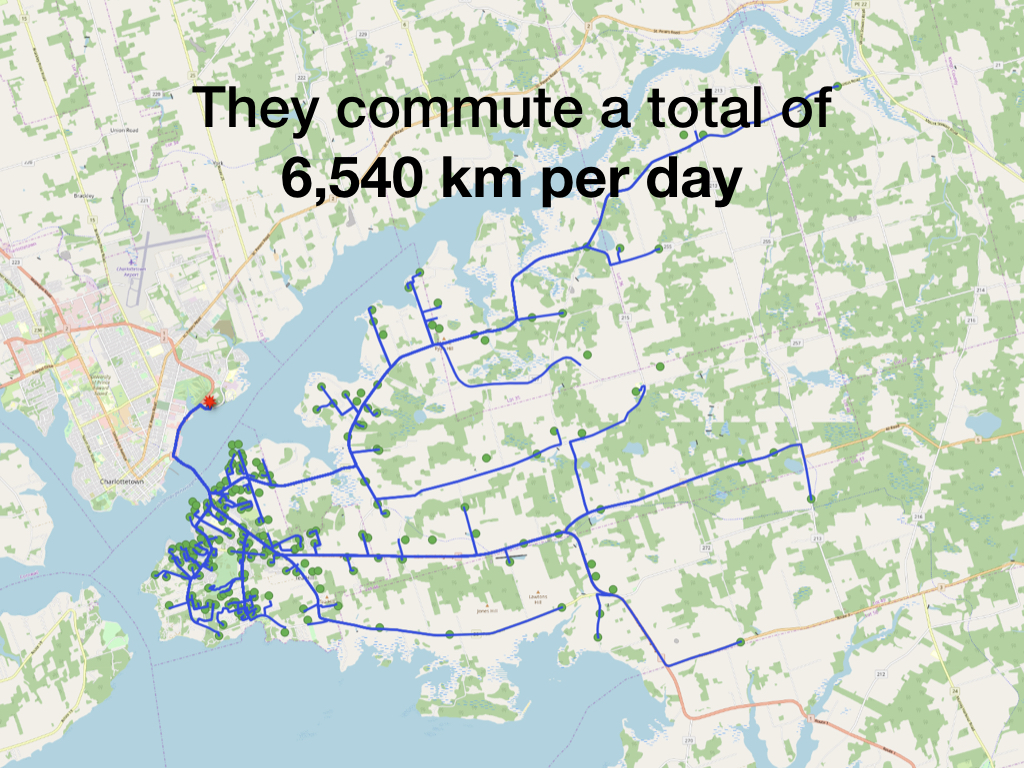
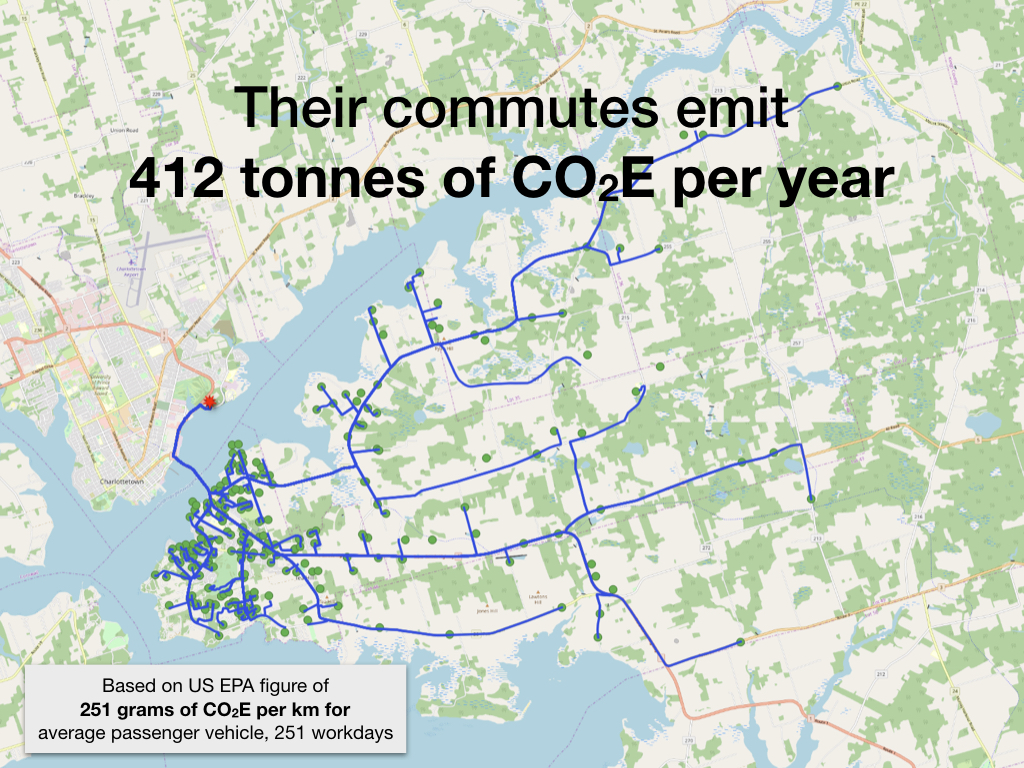
Next, I used the Openrouteservice plug-in for QGIS to calculate their combined total daily commute: Openrouteservice provided me with a driving distance for each postal code that I then merged with my employee count table to get the total commute distance, which I multiplied by two to get the commute to and from work. The result: 6,540 km of driving between Stratford and the QEH every day:
I took that 6,540 km of daily driving, and estimated the carbon emissions of those drives, using the EPA average figure of 251 grams per kilometer of driving, and then multiplying by 251 workdays to get a total emissions per year figure of 412 tonnes:
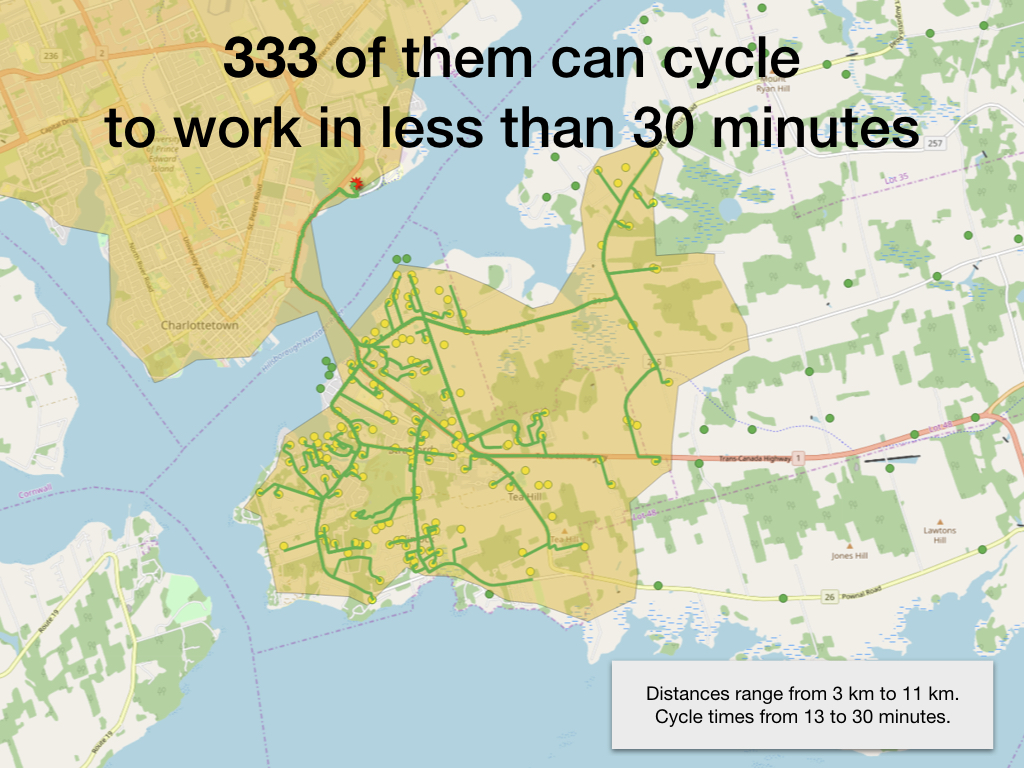
Next I used the Openrouteservice isochrone tool to determine that 333 of those 404 workers can cycle from home to the hospital in under 30 minutes:
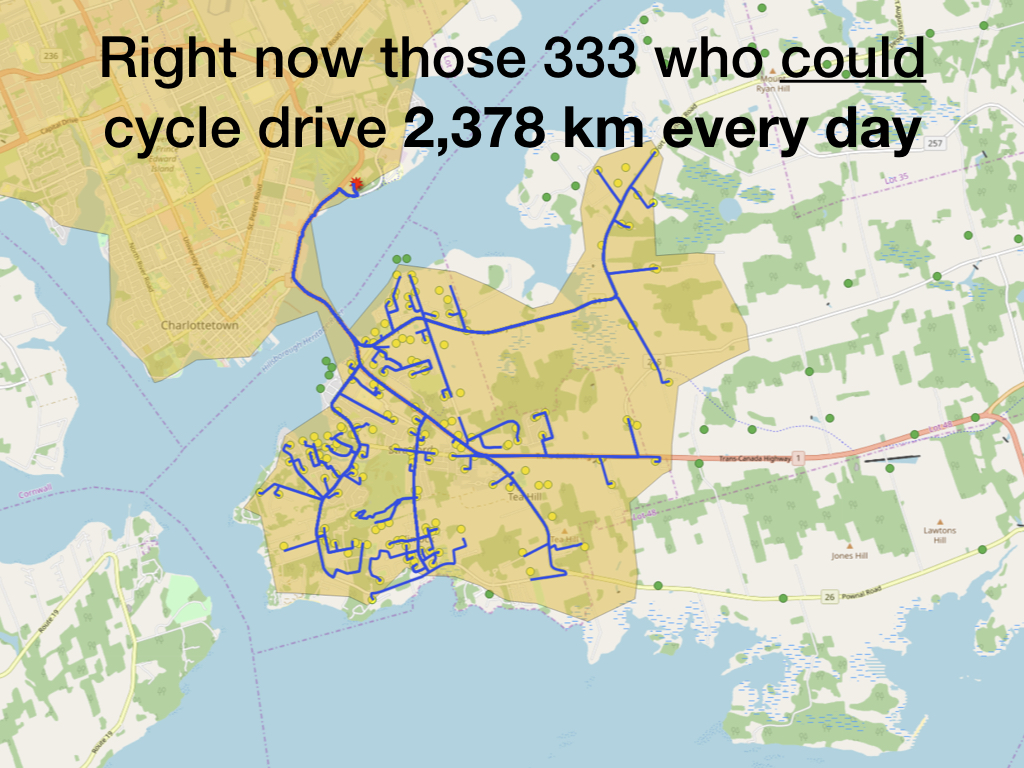
I used the Openrouteservice directions tool to calculate the driving directions for each of those 333 people, determining that if they’re each driving to and from work right now, they’re collectively driving 2,378 km every day:
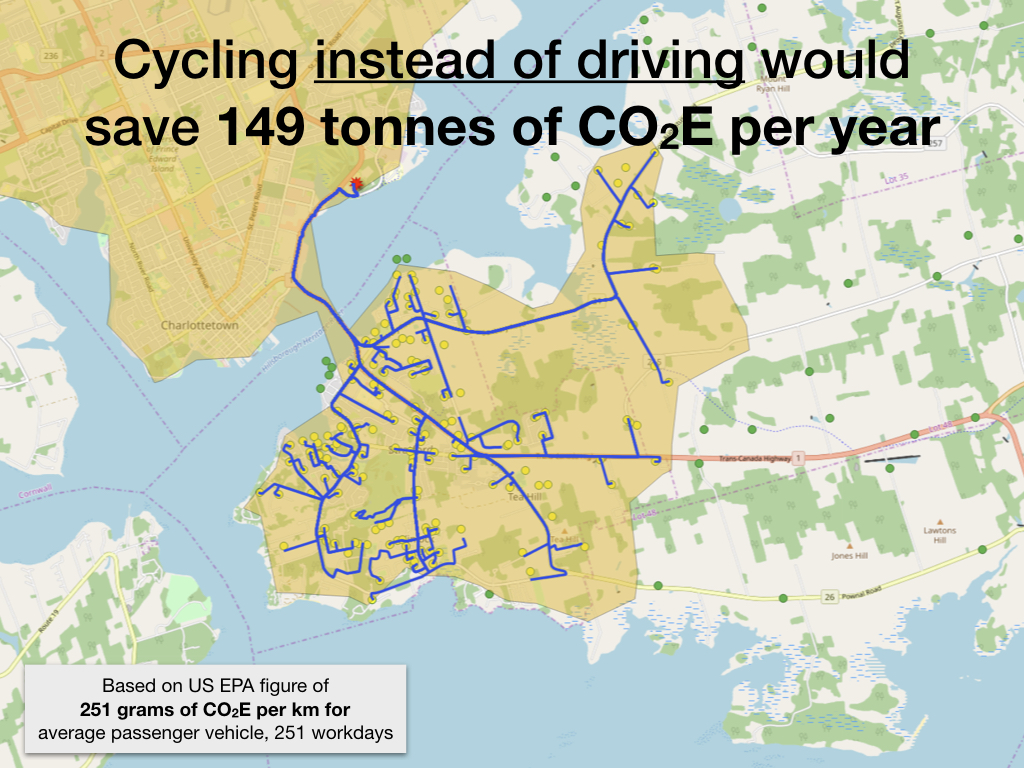
Finally, I calculated the emissions savings if all of those drivers switched to cycling: 149 tonnes of CO2E per year.
I’m only showing maximum potential, of course: 333 people could cycle to Queen Elizabeth Hospital, it doesn’t mean that they will, or that they’re physically capable of doing so, or that they have bicycles, or that it’s safe to do so, even with a lane on the bridge. But it’s a place to start: it shows us what we’re missing, and what we can strive for.
The engineers were a friendly, welcoming lot (and there were a lot of them — more engineers that I ever imagined PEI might have). They asked some good questions, told me some things I didn’t know (like the time in 1997 that the government closed the Provincial Admin Buildings parking lot for a week!). I’m hopeful that some of the data and approaches I demonstrated might prove useful as they conjure our transportation future.
You can download the slide deck I presented as a PDF; I’m working on assembling the data I used, and documenting the analysis I did in more detail, and you can stay tuned for that.
About This Blog
 I am Peter Rukavina and this is my blog. I am a writer, letterpress printer, and a curious person.
To learn more about me, read my /now, look at my bio, listen to audio I’ve posted, read presentations and speeches I’ve written, see things I’ve favourited elsewhere, or get in touch (peter@rukavina.net is the quickest way).
I have been writing here since May 1999: you can explore the 25+ years of blog posts in the archive.
![]() You can subscribe to an RSS feed of posts, an RSS feed of comments, an RSS feed of favourites elsewhere, or a podcast RSS feed that just contains audio posts. You can also receive a daily digests of posts by email. I also publish an OPML blogroll.
You can subscribe to an RSS feed of posts, an RSS feed of comments, an RSS feed of favourites elsewhere, or a podcast RSS feed that just contains audio posts. You can also receive a daily digests of posts by email. I also publish an OPML blogroll.
Instagram • YouTube • Vimeo • ORCID • OpenStreetMap • Internet Archive • PEI.art • Drupal • Github.
Comments
Well done Peter - let's now
Well done Peter - let's now assume that many cannot cycle but that they work remotely for 3 days a week - easier to implement I think
It seems history discovered
It seems history discovered this pre-COVID November 2019 comment regarding working from home, and took it on as a challenge.
Well done! This is the kind
Well done! This is the kind of initiative we need. You have done more to address practical solutions to climate change than any government I am aware of. Now. Let’s get that bike lane built. BTW. I am 75 and do not cycle, so I have no vested interest in this other than to solve the greatest crisis we have ever had.
Great work Peter. Even if 20%
Great work Peter. Even if 20% of those living in Stratford commuted to the QEH, VAC and Provincial Government we'd have ourselves a major shift.
Some interesting statistics -
Some interesting statistics - the Dutch, world-renown for being a cycling super-haven, report 6% of all commutes occur by bicycle. Upper end of cycling commuting and general trips is generally around 5km for their residents. Anything past that is generally only for the young and very fit.
15% move by public transit. 75% of commutes are done by car.
P.9 - https://download.cbs.nl/pdf/2015-transport-and-mobility.pdf
I am 100% on board with safe cycling infrastructure to assist localized transportation - I too am a May - December commuter. However, I think in terms of climate change impact, there is much greater impact in my opinion in investing in rapid electric transit (a 15% transit rate would take 2,400 cars off the road each day vs. 1000 for a 6% cycling rate) and a swift move away from commuting to offices to having people work at home.
That and stricter planning controls that stop sprawling residential areas in favour of tasteful densifications in community corridors where one can work, shop and live within a 5km radius.
Add new comment