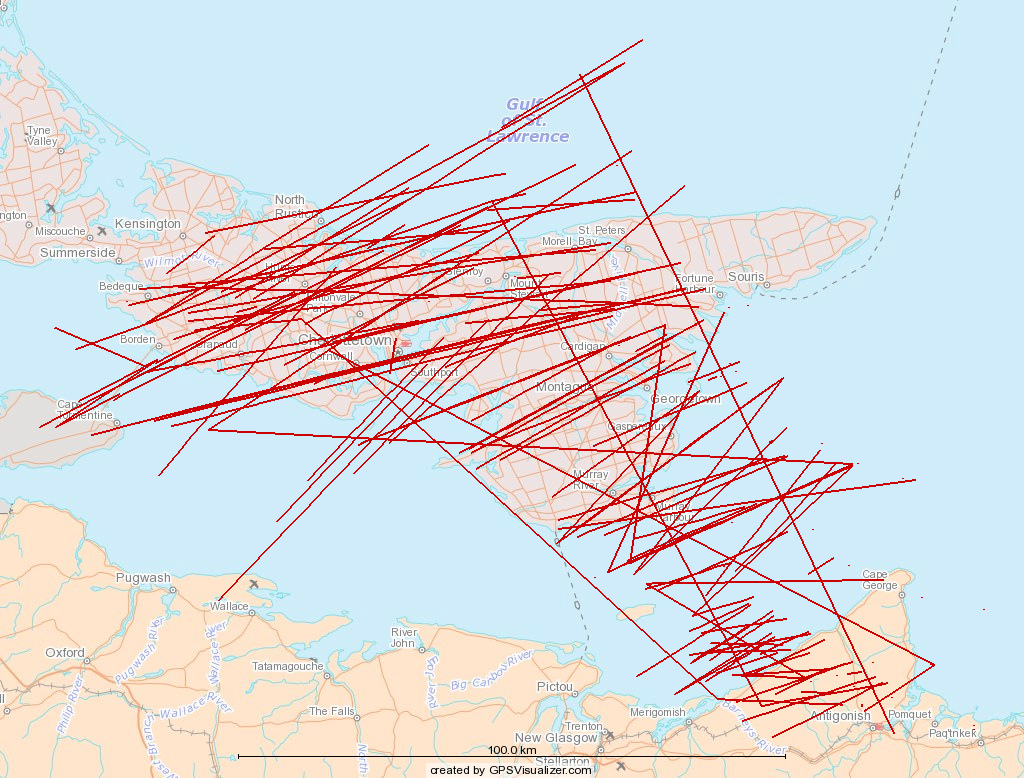
I took the overflights of PEI data that I visualized earlier for an 18 hour period and extended the visualization to include the last 5 days of overflights. Here’s what it looks like:

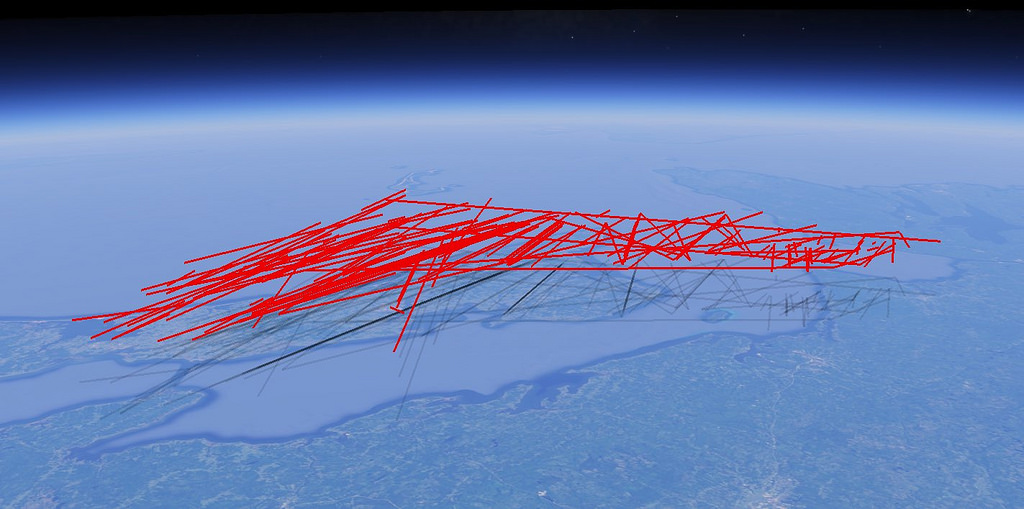
Here’s the same data, but converted into a KML file and loaded into Google Earth, with altitude as well as latitude and longitude used to draw the tracks:

In this image, the intensity of the shadow clamped to the ground tells you something about how frequently a given path has been followed.
 I am
I am
Comments
I’d be interested to see the
I'd be interested to see the PEI flyover density in relation to the amount the surrounding area is overflown. Also to know what proportion represents planes landing there.
Unfortunately, I don’t have
I use planefinder.net to see
I use planefinder.net to see what is going on over PEI. They were kind enough to send me all the equipment I needed to get set up. I had the antenna professionally installed, and the receiver can see south of NS, and almost to Gaspe. I am just starting to explore the software and the info I have available.
Add new comment